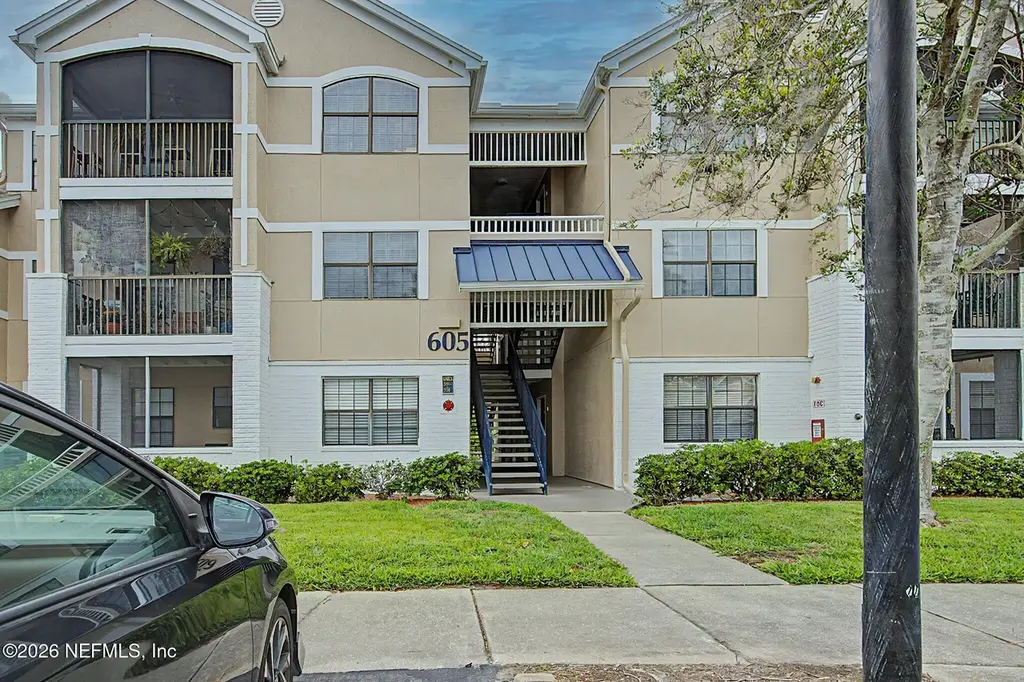
605 Boardwalk Dr #336
Palm Valley, FL 32082
$189,900D
1 bd · 1.0 ba ·
686 sqft ·
Built 1997
· Condo
· Active
· 63 DOM
Cashflow @ list (25.0% down · 7.5%)
Estimated rent
$1,640/mo
Mortgage (P&I)
−$996
Tax + insurance
−$210
HOA
−$306
Vac / Maint / Mgmt
−$344
Net cashflow
$-216/mo
Annual
$-2,591/yr
Cap rate
4.93%
Cash-on-cash
-4.87%
DSCR
0.78
1% rule
0.86%
Cash to close
$53,172
Investor read
- This is a 1-bed/1.0-bath condo listed at $190k.
- At list price, monthly cash flow is $-216 ($-3k/yr) — negative.
- To cash-flow at today's rent, offer at most $152k (20.1% below list).
- To meet the 1% rule (rent ≥ 1% of price), the offer needs to be $164k (13.6% below list).
- It's been on market 63 days — a 6% lower offer ($179k) is reasonable based on typical stale-listing flexibility.
- Recommended offer: $152k (20.1% below list) — sets the bar for cash-flow.
- Local home prices are declining (-3.0%/yr); year-one equity from $1k of loan paydown is wiped out by about $6k of value loss. Plan a longer hold.
- Location reads 69/100 on livability (#462 in FL) — a middle-class / working-renter tenant base. Strengths: schools A+, crime A+, employment A+; Watch: amenities F, commute F, cost of living F.
- St. Johns (rural): math 75% / reading 73% proficiency, ranked #2 of 73 in FL (top 3%) — strong family-tenant draw, lease renewals of 3-5y typical; only 20% free/reduced lunch — higher-income household profile.
- Market conditions: Rents rising fast (+7.4%/yr); 333 active listings in the ZIP; 3 comparable units currently listed for rent nearby; rentals leasing fast (median 3d on market — plan ~1-2 weeks tenant-placement turnaround); high-income renter base; 5,575 units permitted in St. Johns County in 2024 (584 in 5+ unit buildings).
- St. Johns County population projected at +60% by 2050 — long-run rental-demand tailwind backs the buy-and-hold thesis.
- 4 sale attempts since 19y ago with the ask held roughly flat each time — persistent listings suggest the price (not the market) is what's stuck; bring a comps-based counter.
- Current owner paid $115k; list at $190k implies a 65% gain — meaningful room to come down on a strong offer.
- Climate carrying-cost: severe wind risk, 99% chance of damaging wind over 30y; moderate wildfire risk; extreme-heat days projected 7→22/yr by 2055 (HVAC capex compounding) — expect insurance premiums to compound above CPI over the hold.
- Cap rate 4.9% vs local median 2.3% in Palm Valley — top-decile yield for the area; either an underpriced asset or a hidden risk that comps aren't pricing in. Stress-test before assuming the spread holds.
- This rent is only 16% of the median local income ($125k/yr) — well below the 30% rent-burden line; pricing power to push rent on renewal without tenant pushback.
Questions for listing agent
- What do current leases actually rent for vs. the listed asking? Can we see a recent rent roll and the last 12 months of T-12 income?
- It's been on market 63 days. Have you received any prior offers? Is the seller open to a 20% concession, seller financing, or rate buy-down credit?
- What does the HOA fee cover, when was the last increase, and are there any pending special assessments or reserve-fund shortfalls?
- Any open or pending special assessments — roof, HVAC, plumbing, elevator, façade? What's the per-unit balance and payoff schedule, and is the seller paying it off at close or rolling it to the buyer?
- Why hasn't it sold? Are there any deal-killer items the seller is aware of (foundation, flood, title, zoning, code violations)?
- Is there a deadline driving the sale (1031 exchange, divorce, estate, relocation)? That informs how much negotiation room exists.
- Schools are A-rated — typically a magnet for longer-tenancy family renters. What's the average tenant stay here, and is there a school-zone premium baked into asking?
- The area grade is low — what's the realistic commute time and amenity access for the typical tenant pool here? Any planned neighborhood developments (good or bad) we should know about?
CashFlowRE · CFR-YSAKH652KWF6C9
· Data 2 days ago
cashflowre.app · 2026-05-29