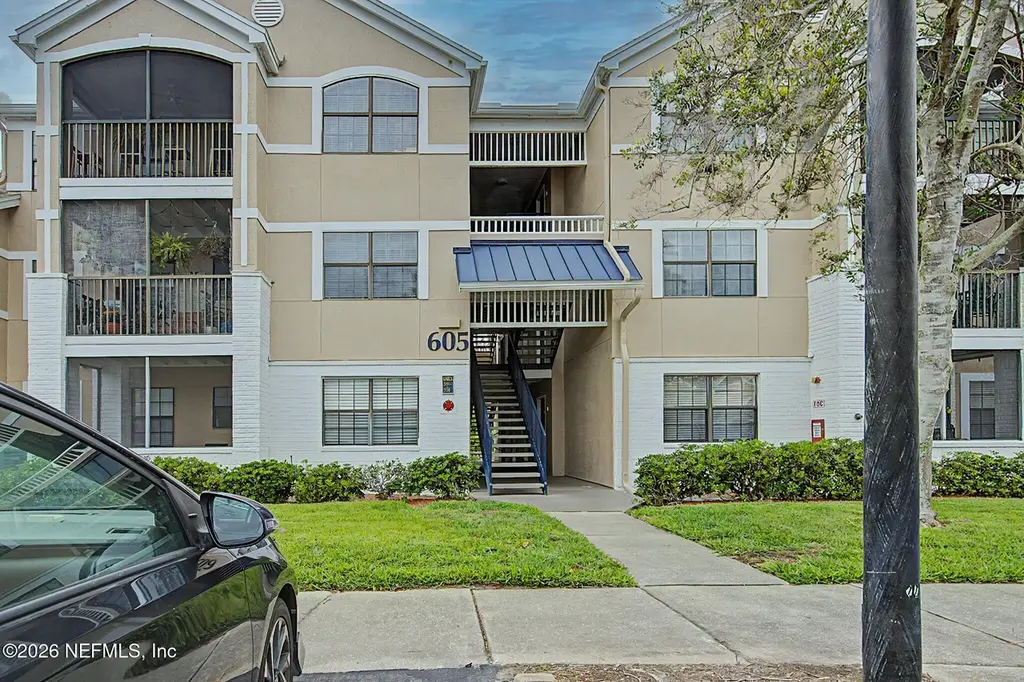
605 Boardwalk Dr #336 · Palm Valley, FL
Flood risk 1/10 · Minimal
- FEMA flood zone
- X (unshaded)
- Chance of flooding over 30 yrs
- 0.0%
- Est. flood insurance / yr
- $507 – $1,088
Fire risk 5/10 · Moderate
- Est. fire insurance / yr
- $947 – $1,759
Heat risk 10/10 · Severe
- Hot days now (above 104°F)
- 7 days/yr
- Hot days in 30 yrs
- 22 days/yr
Wind risk 9/10 · Severe
- Chance of severe wind over 30 yrs
- 99.0%
Air-quality risk 4/10 · Minor
- Unhealthy air days now
- 5 days/yr
- Unhealthy air days in 30 yrs
- 5 days/yr
Risk factors via First Street. Map © Google.
Why this score? — see what drove the D grade
The composite is a weighted blend of 9 inputs, each scored 0–100. Each bar is that input's sub-score; the figure is the points it added to the 100-point composite (weight × sub-score).
- ARV discount +10.5/15.0
- Cash flow +7.7/30.0
- Schools +6.4/10.0
- Rent growth +4.3/5.0
- 1% rule +3.6/10.0
- Livability +3.5/5.0
- Condition / age +2.5/5.0
- DSCR +1.8/10.0
- Appreciation +0.0/10.0
$189,900
🖨 Deal sheet 📄 Offer letter ✓ Due diligence
Listing remarks MLS
Take advantage of this fantastic opportunity at the highly desirable Belleza condominiums with this beautifully updated one-bedroom unit. Enjoy a calming lake view from both the living room and the spacious balcony. Located on the third floor, this unit features high ceilings, a large walk-in closet, a modern bathroom, and fresh paint throughout, making it move-in ready for its new owner. Belleza is a gated community offering a wide range of amenities, including a resort-style pool, outdoor fireplace, summer kitchen with BBQ grill, tennis court, basketball court, beach volleyball court, movie theatre, fitness center, and clubhouse. The prime location provides easy access to Butler, shopping, entertainment, and beaches.
Key facts
- Gated community
- Outdoor fireplace
- Tennis court
Tags
Neighborhood map
What this means for you Summary
Snapshot
- This is a 1-bed/1.0-bath condo listed at $190k.
Deal economics
- At list price, monthly cash flow is $-216 ($-3k/yr) — negative.
- To cash-flow at today's rent, offer at most $152k (20.1% below list).
- To meet the 1% rule (rent ≥ 1% of price), the offer needs to be $164k (13.6% below list).
- Recommended offer: $152k (20.1% below list) — sets the bar for cash-flow.
- Cap rate 4.9% vs local median 2.3% in Palm Valley — top-decile yield for the area; either an underpriced asset or a hidden risk that comps aren't pricing in. Stress-test before assuming the spread holds.
Location & tenants
- Location reads 69/100 on livability (#462 in FL) — a middle-class / working-renter tenant base. Strengths: schools A+, crime A+, employment A+; Watch: amenities F, commute F, cost of living F.
- St. Johns (rural): math 75% / reading 73% proficiency, ranked #2 of 73 in FL (top 3%) — strong family-tenant draw, lease renewals of 3-5y typical; only 20% free/reduced lunch — higher-income household profile.
- Market conditions: Rents rising fast (+7.4%/yr); 333 active listings in the ZIP; 3 comparable units currently listed for rent nearby; rentals leasing fast (median 3d on market — plan ~1-2 weeks tenant-placement turnaround); high-income renter base; 5,575 units permitted in St. Johns County in 2024 (584 in 5+ unit buildings).
- This rent is only 16% of the median local income ($125k/yr) — well below the 30% rent-burden line; pricing power to push rent on renewal without tenant pushback.
Forward outlook
- Local home prices are declining (-3.0%/yr); year-one equity from $1k of loan paydown is wiped out by about $6k of value loss. Plan a longer hold.
- St. Johns County population projected at +60% by 2050 — long-run rental-demand tailwind backs the buy-and-hold thesis.
Negotiation context
- It's been on market 63 days — a 6% lower offer ($179k) is reasonable based on typical stale-listing flexibility.
- 4 sale attempts since 19y ago with the ask held roughly flat each time — persistent listings suggest the price (not the market) is what's stuck; bring a comps-based counter.
- Current owner paid $115k; list at $190k implies a 65% gain — meaningful room to come down on a strong offer.
Risks & watch-outs
- Climate carrying-cost: severe wind risk, 99% chance of damaging wind over 30y; moderate wildfire risk; extreme-heat days projected 7→22/yr by 2055 (HVAC capex compounding) — expect insurance premiums to compound above CPI over the hold.
Questions for the listing agent
- What do current leases actually rent for vs. the listed asking? Can we see a recent rent roll and the last 12 months of T-12 income?
- It's been on market 63 days. Have you received any prior offers? Is the seller open to a 20% concession, seller financing, or rate buy-down credit?
- What does the HOA fee cover, when was the last increase, and are there any pending special assessments or reserve-fund shortfalls?
- Any open or pending special assessments — roof, HVAC, plumbing, elevator, façade? What's the per-unit balance and payoff schedule, and is the seller paying it off at close or rolling it to the buyer?
- Why hasn't it sold? Are there any deal-killer items the seller is aware of (foundation, flood, title, zoning, code violations)?
- Is there a deadline driving the sale (1031 exchange, divorce, estate, relocation)? That informs how much negotiation room exists.
- Schools are A-rated — typically a magnet for longer-tenancy family renters. What's the average tenant stay here, and is there a school-zone premium baked into asking?
- The area grade is low — what's the realistic commute time and amenity access for the typical tenant pool here? Any planned neighborhood developments (good or bad) we should know about?
- What's the average days-on-market for RENTAL listings here right now (not sales)? A rising rental-DOM trend means longer vacancies and softer asking-rent achievability than the comps imply.
- What's the recent tenant-quality profile in this submarket — average credit score on applications, eviction rate, late-payment / NSF rate, and stable-employment percentage? A property-management company in the area should have these aggregated.
- How much new apartment / multifamily construction is in the pipeline within 1–3 miles? Heavy new supply (>2% of stock underway) typically softens rents 12–24 months out; light construction supports rent growth.
Investment metrics
- 1% rule
- 0.86% ✗
- Cap rate
- 4.93%
- Cash-on-cash
- -4.87%
- DSCR
- 0.78
- GRM
- 9.6
CMA / ARV
- ARV (median comp)
- $203,662
- List price
- $189,900
- Delta
- -6.76%
- Verdict
- FAIR
- Comps
- 20 within 1.0 mi
Projected returns pro-forma
-3.0% appreciation · 7.39% rent growth · sell at horizon
- IRR
- -18.9%
- Equity multiple
- 0.31×
- Total profit
- $-36,814
- Equity at exit
- $28,315
- IRR
- -3.5%
- Equity multiple
- 0.71×
- Total profit
- $-15,184
- Equity at exit
- $16,419
Cash invested: $53,172 (down + closing). Projections, not guarantees.
Landlord ↔ Tenant lean methodology
- Overall (STATE)
- 87 Strongly Landlord-Friendly
- State Florida
- 87 Strongly Landlord-Friendly · R+3
- County
- — inherits STATE
- City
- — inherits STATE
ZIP-level market 32082
- Rents YoY
- 7.4%
- Active inventory
- 333
- Price-to-rent
- 9.6×
Monthly cashflow live
- Estimated rent
- $1,640 medium interval (Pro) →
- Mortgage (P&I)
- −$996
- Tax from tax record
- −$130 /mo · $1,566/yr
- Insurance
- −$79
- HOA
- −$306
- Vacancy / Maint / Mgmt
- −$344
- Net cashflow
- $-216
Break-even live
UW: 25.0% down · 7.5% · 30yr · 1.5% tax · 5.0% vac · 8.0% maint · 8.0% mgmt
Financing live
Cash to close
- Down payment
- $47,475
- Closing costs
- $5,697
- Reserves months
- —
- Total cash needed
- —
Loan-product check · same deal, 3 products live
Conventional
25% down · 7.5% · 30yr
- Down + closing
- —
- Monthly P&I
- —
- Monthly cashflow
- —
- DSCR
- —
- Eligible?
- —
Personal DTI + credit; lowest rate.
DSCR
20% down · 8.5% · 30yr
- Down + closing
- —
- Monthly P&I
- —
- Monthly cashflow
- —
- DSCR
- —
- Eligible?
- —
No personal income docs; deal must DSCR.
Hard money
10% down · 12.0% · 12mo
- Down + closing
- —
- Monthly P&I
- —
- Monthly cashflow
- —
- DSCR
- —
- Eligible?
- —
Short-term bridge; refi at stabilization.
Rent comps 3 comps
| Address | Beds | Baths | Sqft | Rent | $/sqft | DOM | Units | Dist |
|---|---|---|---|---|---|---|---|---|
| 805 Boardwalk Dr #523 Ponte Vedra Beach, FL | 1.0 | 1.0 | 686 | $1,550 | $2.26 | 7d | 1 | 0.10mi |
| 611 Ponte Vedra Lakes Blvd Ponte Vedra Beach, FL | 1.0–2.0 | 1.0–2.0 | 919 | $1,324 | $1.44 | 1d | 12 | 0.17mi |
| 125 Great Harbor Way Ponte Vedra Beach, FL | 1.0–2.0 | 1.0–2.0 | 823 | $1,425 | $1.73 | 2d | 13 | 0.27mi |
HOA detail condo
- Monthly dues
- $306 · $3,672/yr
- Likely covers
- poolgymsecurity
- Assessments
- None detected in remarks — confirm with the listing agent.
Listing history 26 events
-
2026-06-18days on market $189,900 Active 63 DOM
-
2026-06-17days on market $189,900 Active 62 DOM
-
2026-06-16days on market $189,900 Active 61 DOM
-
2026-06-15days on market $189,900 Active 60 DOM
-
2026-06-13days on market $189,900 Active 58 DOM
-
2026-06-13days on market $189,900 Active 57 DOM
-
2026-06-10days on market $189,900 Active 54 DOM
-
2026-06-08days on market $189,900 Active 53 DOM
-
2026-06-07days on market $189,900 Active 52 DOM
-
2026-06-03days on market $189,900 Active 48 DOM
-
2026-06-02days on market $189,900 Active 47 DOM
-
2026-06-01days on market $189,900 Active 46 DOM
-
2026-05-31days on market $189,900 Active 45 DOM
-
2026-04-15$194,900 Active 728-char remark
Show marketing remark (728 chars)
Take advantage of this fantastic opportunity at the highly desirable Belleza condominiums with this beautifully updated one-bedroom unit. Enjoy a calming lake view from both the living room and the spacious balcony. Located on the third floor, this unit features high ceilings, a large walk-in closet, a modern bathroom, and fresh paint throughout, making it move-in ready for its new owner. Belleza is a gated community offering a wide range of amenities, including a resort-style pool, outdoor fireplace, summer kitchen with BBQ grill, tennis court, basketball court, beach volleyball court, movie theatre, fitness center, and clubhouse. The prime location provides easy access to Butler, shopping, entertainment, and beaches.
-
2018-02-08soldstatus $115,000
-
2018-02-02soldstatus $115,000 Sold 260-char remark
Show marketing remark (260 chars)
Furnished, crisp and perfect 1 bedroom unit on the 3rd floor. This unit is super private with a nice view of the woods and a lake. It has all new appliances, new carpet and an updated vanity in the bath. Just bring your suitcase! Close to Mayo and Butler Blvd.
-
2017-12-22historical Active - Contingent 260-char remark
Show marketing remark (260 chars)
Furnished, crisp and perfect 1 bedroom unit on the 3rd floor. This unit is super private with a nice view of the woods and a lake. It has all new appliances, new carpet and an updated vanity in the bath. Just bring your suitcase! Close to Mayo and Butler Blvd.
-
2017-12-20$118,000 Active 260-char remark
Show marketing remark (260 chars)
Furnished, crisp and perfect 1 bedroom unit on the 3rd floor. This unit is super private with a nice view of the woods and a lake. It has all new appliances, new carpet and an updated vanity in the bath. Just bring your suitcase! Close to Mayo and Butler Blvd.
-
2017-05-23soldstatus $110,000
-
2017-05-18soldstatus $105,000 Sold
-
2017-05-08status Pending
-
2017-05-06price $114,995
-
2017-04-27$119,995 Active
-
2007-07-01historical
-
2007-03-29$155,000
-
2005-03-14soldstatus $123,900
ⓘ Source: listings_history table (triggers on properties + properties_extension) + one-shot
backfill from property_details.listing_events for pre-trigger history.
Tax reassessment forecast FL · Resets to sale price
- Current annual tax
- $1,566 · $130/mo
- Projected year-2 tax
- $1,576 · $131/mo
- Expected delta
- +$10/yr (+$1/mo · 0.7%)
ⓘ Screening estimate from a state-policy table — verify with the county assessor before closing.
Climate risk First Street
- Flood 1/10 Low FEMA zone X (unshaded) · 0% chance over 30 yrs
- Wildfire 5/10 Major
- Heat 10/10 Extreme 7 d/yr ≥104°F today · 22 d/yr by 30 yrs out
- Wind 9/10 Extreme 99% chance of damaging wind over 30 yrs
- Air quality 4/10 Moderate 5 unhealthy d/yr today · 5 by 30 yrs out
Nearby sold comps map
Loading sold comps map…
Walkable amenities ~0.75 mi
Loading nearby amenities…
Taxation est. · year 1
- Rental income
- $19,679
- − Mortgage interest
- −$10,637
- − Property taxes
- −$1,566
- − Insurance
- −$950
- − Repairs & maintenance
- −$1,574
- − Management
- −$1,574
- − HOA
- −$3,672
- − Depreciation
- −$5,524
- Taxable loss
- −$5,819
- Est. tax savings @ 24.0%
- +$1,396
- After-tax cash flow
- $-1,195/yr
For passive investors: Depreciation is non-cash, so a rental often shows a tax loss while cash-flowing — sheltering income. Rental losses are passive: they offset passive income freely, and up to $25,000/yr can offset ordinary (W-2) income if you actively participate and your MAGI is under $100k (phasing out to $0 by $150k); unused losses carry forward. On sale, claimed depreciation is recaptured at up to 25%, and gains may owe capital-gains tax (a 1031 exchange can defer both). Figures are a year-1 estimate at your 24.0% rate — not tax advice; consult a CPA.
Schools (NCES district)
- District
- St. Johns
- NCES district ID
- 1201740
- Math proficiency
- 75% ▼ -5.00%
- Reading proficiency
- 73% ▼ -2.00%
- Median HH income
- $66,842
- Composite
- 64.31/100
- National rank
- #556
- State rank
- #2 of 73 in FL
Livability — Palm Valley
- Score
- 69/100
- State rank
- #462
- US rank
- #8349
Category grades
Schools grade is shown separately in the Schools card above.
Census & demographics
- Census place
- Palm Valley, FL
- County
- Saint Johns County · 301,599 people
- Metro
- Jacksonville, FL
- Population (ZIP)
- 29,289
- Household income
- $124,558
- Rent vs Own
- Severe rent burden
- 672.0
Population outlook (St. Johns County) Hauer SSP2
- Today (2025)
- 303,941 people
- By 2030
- 342,590 · +12.7%
- By 2040
- 417,328 · +37.3%
- By 2050
- 487,011 · +60.2%
- By 2075
- 635,395 · +109.1%
- By 2100
- 717,469 · +136.1%
Race, ethnicity, and origin ACS 2023
- Neighborhood character
- Predominantly White (87%)
- Race & ethnicity
- White 87% Two or more races 6% Hispanic / Latino 6% Asian 3% Black 1%
- Hispanic origin (detail)
- Puerto Rican 1% Cuban 1%
- Common ancestry
- Slovak 4% Romanian 3% Italian 3%
- Foreign-born
- 9% · Canada, China
- Languages at home
- 91% English-only · Spanish 3% Other Indo-European 2% Russian/Polish/Slavic 1%
Political lean MEDSL · St. Johns
- 2024 margin
- Solid R (+31.4) · D 33.9% · R 65.2%
- 2008→2024 swing
- +0.2pp no change · 2008: -31.6pp · 2024: -31.4pp
- All cycles
- 2024: R+31.4 2020: R+26.7 2016: R+33.4 2012: R+37.8 2008: R+31.6
Not yet ingested
- Civics
- —
Market trends
- HPI YoY
- ▼ -435.26%
- Current HPI
- 306.134
- Rent YoY
- ▲ 7.39%
- Metro
- Jacksonville, FL
- State GDP YoY
- ▲ 3.28%
- F500 in state
- 36
Industry mix (Fortune 500 HQ in FL)
| Industry | F500 HQs | Revenue |
|---|---|---|
| Industrial Technology | 2 | $29B |
|
||
| Insurance | 2 | $17B |
|
||
| Retail | 1 | $60B |
|
||
| Technology Distribution | 1 | $58B |
|
||
| Homebuilding | 1 | $35B |
|
||
| Technology Manufacturing | 1 | $35B |
|
||
Price history
+57.3% since first listed13 events — show timeline
- 2026-04-15 Listed $194,900 realMLS
- 2018-02-08 Sold (Public Records) $115,000 Public Records
- 2018-02-02 Sold (MLS) $115,000 realMLS
- 2017-12-22 Contingent — realMLS
- 2017-12-20 Listed $118,000 realMLS
- 2017-05-23 Sold (Public Records) $110,000 Public Records
- 2017-05-18 Sold (MLS) $105,000 realMLS
- 2017-05-08 Pending — realMLS
- 2017-05-06 Price Changed $114,995 realMLS
- 2017-04-27 Listed $119,995 realMLS
- 2007-07-01 Listing Removed — realMLS
- 2007-03-29 Listed $155,000 realMLS
- 2005-03-14 Sold (Public Records) $123,900 Public Records
Property tax history
+6.6%/yrLatest (2025): $1,566 · +5.0% YoY. Source: county tax records.
Cash-flow waterfall
monthlySold comps — $/sqft
last 12 mo · ≤1 miLoading sold comps…