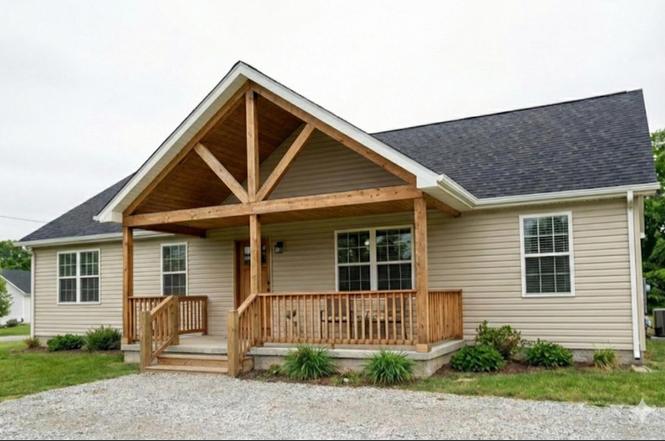
2250 Jason Avenue Ave
Van Buren, MO 63965
$159,000D
3 bd · 2.0 ba ·
1,400 sqft ·
Built 2026
· SingleFamily
· Pending
· 16 DOM
Cashflow @ list (25.0% down · 7.5%)
Estimated rent
$1,095/mo
Mortgage (P&I)
−$834
Tax + insurance
−$265
HOA
−$0
Vac / Maint / Mgmt
−$230
Net cashflow
$-234/mo
Annual
$-2,809/yr
Cap rate
4.53%
Cash-on-cash
-6.31%
DSCR
0.72
1% rule
0.69%
Cash to close
$44,520
Investor read
- This is a 3-bed/2.0-bath single-family listed at $159k.
- At list price, monthly cash flow is $-234 ($-3k/yr) — negative.
- To cash-flow at today's rent, offer at most $125k (21.3% below list).
- To meet the 1% rule (rent ≥ 1% of price), the offer needs to be $109k (31.2% below list).
- It's been on market 16 days — a 2% lower offer ($157k) is reasonable based on typical stale-listing flexibility.
- Recommended offer: $109k (31.2% below list) — sets the bar for 1% rule.
- In year one you build about $16k of equity ($1k loan paydown + $15k appreciation (9.5% local appreciation)).
- Location reads 59/100 on livability (#516 in MO) — a working-class tenant base; expect higher turnover. Strengths: cost of living A+, crime A-; Watch: housing C-, health & safety C-, amenities F.
- Van Buren R-I (rural): math 37% / reading 42% proficiency, ranked #169 of 324 in MO (top 52%) — families likely to look elsewhere, expect single-tenant / working-renter base with shorter leases.
- Zoned schools: Van Buren Elem. (math 47% / reading 42%, grade F, #413 of 1,115 statewide, top 42%, 291 students, 70% FRL); Van Buren High (math 22% / reading 37%, grade F, #382 of 521 statewide, top 78%, 225 students, 57% FRL).
- Market conditions: 108 active listings in the ZIP; 2 units permitted in Carter County in 2024 (0 in 5+ unit buildings).
- Carter County population projected to shrink 10% by 2050 — rents likely to lag national; underwrite the cash flow, not the appreciation.
- By year 3, paydown + projected appreciation supports a ~$41k cash-out refi (75% LTV) — recoverable capital for the next deal without selling this one.
- Cap rate 4.5% vs local median 1.8% in Van Buren — top-decile yield for the area; either an underpriced asset or a hidden risk that comps aren't pricing in. Stress-test before assuming the spread holds.
Questions for listing agent
- What do current leases actually rent for vs. the listed asking? Can we see a recent rent roll and the last 12 months of T-12 income?
- Is there a deadline driving the sale (1031 exchange, divorce, estate, relocation)? That informs how much negotiation room exists.
- Schools are D-rated, which usually means shorter tenancies and higher turnover. Who's the typical renter profile here, and what's been the actual vacancy rate?
- The area grade is low — what's the realistic commute time and amenity access for the typical tenant pool here? Any planned neighborhood developments (good or bad) we should know about?
- What's the average days-on-market for RENTAL listings here right now (not sales)? A rising rental-DOM trend means longer vacancies and softer asking-rent achievability than the comps imply.
- What's the recent tenant-quality profile in this submarket — average credit score on applications, eviction rate, late-payment / NSF rate, and stable-employment percentage? A property-management company in the area should have these aggregated.
- How much new for-sale + rental construction is in the pipeline within 1–3 miles? Heavy new supply typically softens prices + rents 12–24 months out; constrained supply supports both.
CashFlowRE · CFR-YSBQ9K03DFV0J3
· Data 3 weeks ago
cashflowre.app · 2026-05-29