2250 Jason Avenue Ave · Van Buren, MO
Flood risk No data
- FEMA flood zone
- —
- Chance of flooding over 30 yrs
- —
- Est. flood insurance / yr
- —
Fire risk No data
- Est. fire insurance / yr
- —
Heat risk No data
- Hot days now (above threshold)
- —
- Hot days in 30 yrs
- —
Wind risk No data
- Chance of severe wind over 30 yrs
- —
Air-quality risk No data
- Unhealthy air days now
- —
- Unhealthy air days in 30 yrs
- —
Risk factors via First Street. Map © Google.
Why this score? — see what drove the D grade
The composite is a weighted blend of 9 inputs, each scored 0–100. Each bar is that input's sub-score; the figure is the points it added to the 100-point composite (weight × sub-score).
- ARV discount +11.3/15.0
- Appreciation +9.8/10.0
- Cash flow +7.0/30.0
- Schools +3.3/10.0
- Livability +3.0/5.0
- Rent growth +2.5/5.0
- Condition / age +2.5/5.0
- 1% rule +1.9/10.0
- DSCR +1.2/10.0
$159,000
🖨 Deal sheet 📄 Offer letter ✓ Due diligence
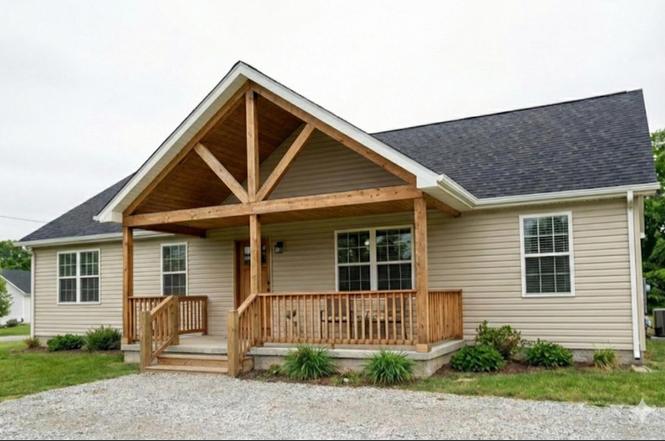
Listing remarks
Dreaming of a New Construction Home in Van Buren, Mo? This floor plan offers a spacious 3-bedroom, 2-bath home thoughtfully designed for a starter home or weekend retreat. The open main floor connects the spacious kitchen, making it perfect for gatherings and everyday life. This plan offers a primary suite that includes a private bath and walk-in closet. Don't miss out on this new construction home which is a rarity to find on the open market. Finishes IncludeAll ElectricCentral Heat and AirAll AppliancesVaulted Living Room/Kitchen Ceiling with Wood Car sidingVinyl Plank Flooring throughoutVinyl Single Hung WindowsVinyl Siding Spray Foam InsulationLaminate Countertops * Photos are represen
Key facts
- Private bath
- Walk-in closet
- Spacious kitchen
Tags
Neighborhood map
What this means for you Summary
Snapshot
- This is a 3-bed/2.0-bath single-family listed at $159k.
Deal economics
- At list price, monthly cash flow is $-234 ($-3k/yr) — negative.
- To cash-flow at today's rent, offer at most $125k (21.3% below list).
- To meet the 1% rule (rent ≥ 1% of price), the offer needs to be $109k (31.2% below list).
- Recommended offer: $109k (31.2% below list) — sets the bar for 1% rule.
- Cap rate 4.5% vs local median 1.9% in Van Buren — top-decile yield for the area; either an underpriced asset or a hidden risk that comps aren't pricing in. Stress-test before assuming the spread holds.
Location & tenants
- Location reads 59/100 on livability (#516 in MO) — a working-class tenant base; expect higher turnover. Strengths: cost of living A+, crime A-; Watch: housing C-, health & safety C-, amenities F.
- Van Buren R-I (rural): math 37% / reading 42% proficiency, ranked #169 of 324 in MO (top 52%) — families likely to look elsewhere, expect single-tenant / working-renter base with shorter leases.
- Zoned schools: Van Buren Elem. (math 47% / reading 42%, grade F, #413 of 1,115 statewide, top 42%, 291 students, 70% FRL); Van Buren High (math 22% / reading 37%, grade F, #382 of 521 statewide, top 78%, 225 students, 57% FRL).
- Market conditions: 108 active listings in the ZIP; 2 units permitted in Carter County in 2024 (0 in 5+ unit buildings).
Forward outlook
- In year one you build about $16k of equity ($1k loan paydown + $15k appreciation (9.5% local appreciation)).
- Carter County population projected to shrink 10% by 2050 — rents likely to lag national; underwrite the cash flow, not the appreciation.
- By year 3, paydown + projected appreciation supports a ~$41k cash-out refi (75% LTV) — recoverable capital for the next deal without selling this one.
Negotiation context
- It's been on market 16 days — a 2% lower offer ($157k) is reasonable based on typical stale-listing flexibility.
Questions for the listing agent
- What do current leases actually rent for vs. the listed asking? Can we see a recent rent roll and the last 12 months of T-12 income?
- Is there a deadline driving the sale (1031 exchange, divorce, estate, relocation)? That informs how much negotiation room exists.
- Schools are D-rated, which usually means shorter tenancies and higher turnover. Who's the typical renter profile here, and what's been the actual vacancy rate?
- The area grade is low — what's the realistic commute time and amenity access for the typical tenant pool here? Any planned neighborhood developments (good or bad) we should know about?
- What's the average days-on-market for RENTAL listings here right now (not sales)? A rising rental-DOM trend means longer vacancies and softer asking-rent achievability than the comps imply.
- What's the recent tenant-quality profile in this submarket — average credit score on applications, eviction rate, late-payment / NSF rate, and stable-employment percentage? A property-management company in the area should have these aggregated.
- How much new for-sale + rental construction is in the pipeline within 1–3 miles? Heavy new supply typically softens prices + rents 12–24 months out; constrained supply supports both.
Investment metrics
- 1% rule
- 0.69% ✗
- Cap rate
- 4.53%
- Cash-on-cash
- -6.31%
- DSCR
- 0.72
- GRM
- 12.1
CMA / ARV
- ARV (on-the-fly)
- $173,600
- Comps found
- 6
Show comp detail 6 sales within ~0.75 mi
| Address | Dist | Beds/Ba | Sqft | Sold | Price | $/sf | Match |
|---|---|---|---|---|---|---|---|
| 1807 Payton Place Dr | 0.21mi | 3/2.0 | 1,400 (0%) | 5mo | $134,900 | $96 | 86 |
| 2700 Jason Ave | 0.19mi | 3/2.0 | 1,400 (0%) | 16mo | $189,900 | $136 | 78 |
| 1607 Broadway St | 0.53mi | 3/2.0 | 1,300 (-7%) | 1mo | $289,000 | $222 | 63 |
| 1505 Dale St | 0.66mi | 3/1.5 | 1,377 (-2%) | 4mo | $72,760 | $53 | 62 |
| 1410 Broadway | 0.68mi | 2/1.5 (-1) | 1,400 (0%) | 18mo | $129,900 | $93 | 46 |
| 1702 Elm | 0.60mi | 3/2.0 | 1,212 (-13%) | 10mo | $150,000 | $124 | 41 |
Match score weights: distance 35% · size 25% · config 20% · recency 20%. Top-matched comps best support the ARV.
Projected returns pro-forma
9.54% appreciation · 3.0% rent growth · sell at horizon
- IRR
- 18.8%
- Equity multiple
- 2.50×
- Total profit
- $66,700
- Equity at exit
- $137,919
- IRR
- 17.4%
- Equity multiple
- 5.65×
- Total profit
- $206,964
- Equity at exit
- $291,941
Cash invested: $44,520 (down + closing). Projections, not guarantees.
Landlord ↔ Tenant lean methodology
- Overall (STATE)
- 81 Strongly Landlord-Friendly
- State Missouri
- 81 Strongly Landlord-Friendly · R+10
- County
- — inherits STATE
- City
- — inherits STATE
ZIP-level market 63965
- Home prices YoY
- 6.2%
- Active inventory
- 108
- Price-to-rent
- 12.1×
Monthly cashflow live
- Estimated rent
- $1,095 medium interval (Pro) →
- Mortgage (P&I)
- −$834
- Tax est. 1.5%
- −$199 /mo · $2,385/yr
- Insurance
- −$66
- HOA
- −$0
- Vacancy / Maint / Mgmt
- −$230
- Net cashflow
- $-234
Break-even live
UW: 25.0% down · 7.5% · 30yr · 1.5% tax · 5.0% vac · 8.0% maint · 8.0% mgmt
Financing live
Cash to close
- Down payment
- $39,750
- Closing costs
- $4,770
- Reserves months
- —
- Total cash needed
- —
Loan-product check · same deal, 3 products live
Conventional
25% down · 7.5% · 30yr
- Down + closing
- —
- Monthly P&I
- —
- Monthly cashflow
- —
- DSCR
- —
- Eligible?
- —
Personal DTI + credit; lowest rate.
DSCR
20% down · 8.5% · 30yr
- Down + closing
- —
- Monthly P&I
- —
- Monthly cashflow
- —
- DSCR
- —
- Eligible?
- —
No personal income docs; deal must DSCR.
Hard money
10% down · 12.0% · 12mo
- Down + closing
- —
- Monthly P&I
- —
- Monthly cashflow
- —
- DSCR
- —
- Eligible?
- —
Short-term bridge; refi at stabilization.
Listing history 2 events
-
2026-01-29status Pending
-
2026-01-13$159,000 Active
ⓘ Source: listings_history table (triggers on properties + properties_extension) + one-shot
backfill from property_details.listing_events for pre-trigger history.
Nearby sold comps map
Loading sold comps map…
Walkable amenities ~0.75 mi
Loading nearby amenities…
Taxation est. · year 1
- Rental income
- $13,135
- − Mortgage interest
- −$8,906
- − Property taxes
- −$2,385
- − Insurance
- −$795
- − Repairs & maintenance
- −$1,051
- − Management
- −$1,051
- − Depreciation
- −$4,625
- Taxable loss
- −$5,679
- Est. tax savings @ 24.0%
- +$1,363
- After-tax cash flow
- $-1,446/yr
For passive investors: Depreciation is non-cash, so a rental often shows a tax loss while cash-flowing — sheltering income. Rental losses are passive: they offset passive income freely, and up to $25,000/yr can offset ordinary (W-2) income if you actively participate and your MAGI is under $100k (phasing out to $0 by $150k); unused losses carry forward. On sale, claimed depreciation is recaptured at up to 25%, and gains may owe capital-gains tax (a 1031 exchange can defer both). Figures are a year-1 estimate at your 24.0% rate — not tax advice; consult a CPA.
Schools (NCES district)
- District
- Van Buren R-I
- NCES district ID
- 2930750
- Math proficiency
- 37% ▼ -7.00%
- Reading proficiency
- 42% ▼ -5.00%
- Median HH income
- $36,880
- Composite
- 32.81/100
- National rank
- #5624
- State rank
- #169 of 324 in MO
Livability — Van Buren
- Score
- 59/100
- State rank
- #516
- US rank
- #19632
Category grades
Schools grade is shown separately in the Schools card above.
Census & demographics
- Census place
- Van Buren, MO
- Population (ZIP)
- 2,433
Population outlook (Carter County) Hauer SSP2
- Today (2025)
- 6,169 people
- By 2030
- 6,050 · -1.9%
- By 2040
- 5,824 · -5.6%
- By 2050
- 5,583 · -9.5%
- By 2075
- 4,900 · -20.6%
- By 2100
- 4,002 · -35.1%
Race, ethnicity, and origin ACS 2023
- Neighborhood character
- Predominantly White (97%)
- Race & ethnicity
- White 97% Two or more races 3%
- Common ancestry
- Italian 3% Serbian 2% Romanian 2%
- Foreign-born
- 0%
Political lean MEDSL · Carter
- 2024 margin
- Solid R (+74.2) · D 12.7% · R 86.9%
- 2008→2024 swing
- -44.7pp toward R · 2008: -29.5pp · 2024: -74.2pp
- All cycles
- 2024: R+74.2 2020: R+70.2 2016: R+66.4 2012: R+43.7 2008: R+29.5
Not yet ingested
- Civics
- —
Market trends
- HPI YoY
- ▲ 9.54%
- Current HPI
- 162.5634
- Rent YoY
- —
- Metro
- —
- State GDP YoY
- ▲ 1.84%
- F500 in state
- 20
Industry mix (Fortune 500 HQ in MO)
| Industry | F500 HQs | Revenue |
|---|---|---|
| Healthcare | 1 | $163B |
|
||
| Insurance | 1 | $21B |
|
||
| Industrial Technology | 1 | $17B |
|
||
| Retail | 1 | $16B |
|
||
| Industrial Distribution | 1 | $10B |
|
||
| Utilities | 1 | $9B |
|
||
Price history
2 events — show timeline
- 2026-01-29 Pending — SOMO
- 2026-01-13 Listed $159,000 SOMO
Cash-flow waterfall
monthlySold comps — $/sqft
last 12 mo · ≤1 miLoading sold comps…