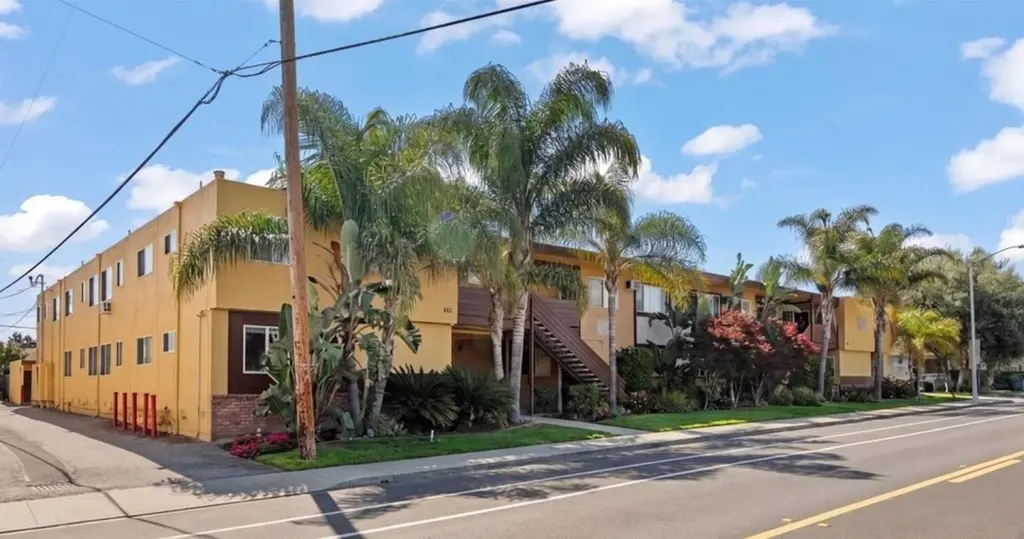
925 Pomeroy Ave
Santa Clara, CA 95051
$7,500,000B-
480 bd · 400.0 ba ·
12,869 sqft ·
Built 1961
· MultiFamily
· Active
· 47 DOM
Cashflow @ list (25.0% down · 7.5%)
Estimated rent
$88,454/mo
Mortgage (P&I)
−$39,331
Tax + insurance
−$11,164
HOA
−$0
Vac / Maint / Mgmt
−$18,575
Net cashflow
$19,384/mo
Annual
$232,609/yr
Cap rate
9.39%
Cash-on-cash
11.08%
DSCR
1.49
1% rule
1.18%
Cash to close
$2,100,000
Investor read
- This is a 20 × 24-bed/20.0-bath units multifamily listed at $7.50M.
- At list price, monthly cash flow is $19k ($233k/yr) — positive. Per door: $969/mo.
- The deal already cash-flows at list — no discount required.
- Meets the 1% rule at list price ($88k rent vs $7.50M).
- It's been on market 47 days — a 3% lower offer ($7.28M) is reasonable based on typical stale-listing flexibility.
- Recommended offer: $7.28M (3.0% below list) — sets the bar for market timing.
- Local home prices are declining (-3.0%/yr); year-one equity from $52k of loan paydown is wiped out by about $225k of value loss. Plan a longer hold.
- Location reads 78/100 on livability (#69 in CA, #2,627 nationally) — a middle-class / working-renter tenant base. Strengths: amenities A+, commute A+, employment A+; Watch: cost of living F.
- Santa Clara Unified (urban): math 49% / reading 66% proficiency, ranked #75 of 517 in CA (top 14%) — acceptable for families but not a draw, mixed tenant base, ~2y average lease.
- Market conditions: Rents rising fast (+5.3%/yr); 100 active listings in the ZIP; high-income renter base; 3,838 units permitted in Santa Clara County in 2024 (1,886 in 5+ unit buildings).
- Santa Clara County population projected at +24% by 2050 — long-run rental-demand tailwind backs the buy-and-hold thesis.
- 16 sale attempts since 27y ago with the ask held roughly flat each time — persistent listings suggest the price (not the market) is what's stuck; bring a comps-based counter.
- At projected returns (-3.0% appreciation + 5.3% rent growth), your $2.10M cash investment doubles in ~9 years — after that, you're playing with house money.
- Climate carrying-cost: extreme-heat days projected 7→14/yr by 2055 (HVAC capex compounding) — expect insurance premiums to compound above CPI over the hold.
- Cap rate 9.4% vs local median 1.3% in Santa Clara — top-decile yield for the area; either an underpriced asset or a hidden risk that comps aren't pricing in. Stress-test before assuming the spread holds.
- At $88,454/mo this rent would consume 540% of the median local household income ($197k/yr) (locally 1993% of renters already pay >50% of income on rent) — very limited rent-growth headroom before tenants either downsize or default.
Questions for listing agent
- It's been on market 47 days. Have you received any prior offers? Is the seller open to a 3% concession, seller financing, or rate buy-down credit?
- Can we see the unit-by-unit rent roll, current vacancy, and any below-market leases? What's the average tenancy length?
- What capital expenditures (roof, boiler, parking lot, exteriors) have been made in the last 5 years, and what's planned in the next 2?
- Built in 1961 — when were the roof, HVAC, electrical panel, plumbing, and water heater last replaced?
- Is there a deadline driving the sale (1031 exchange, divorce, estate, relocation)? That informs how much negotiation room exists.
- Schools are B-rated — typically a magnet for longer-tenancy family renters. What's the average tenant stay here, and is there a school-zone premium baked into asking?
- What's the average days-on-market for RENTAL listings here right now (not sales)? A rising rental-DOM trend means longer vacancies and softer asking-rent achievability than the comps imply.
- What's the recent tenant-quality profile in this submarket — average credit score on applications, eviction rate, late-payment / NSF rate, and stable-employment percentage? A property-management company in the area should have these aggregated.
CashFlowRE · CFR-YSZMMNDWFE96RP
· Data 2 days ago
cashflowre.app · 2026-05-29