 20-Plex
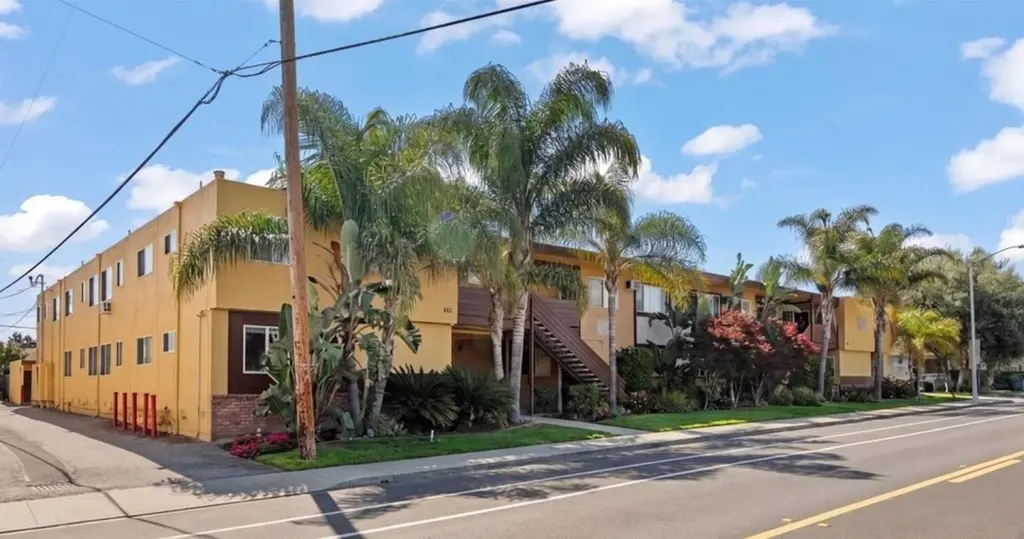
925 Pomeroy Ave · Santa Clara, CA
Flood risk 1/10 · Minimal
- FEMA flood zone
- X (shaded)
- Chance of flooding over 30 yrs
- 0.0%
- Est. flood insurance / yr
- $507 – $1,088
Fire risk 1/10 · Minimal
- Est. fire insurance / yr
- $659 – $1,223
Heat risk 5/10 · Moderate
- Hot days now (above 93°F)
- 7 days/yr
- Hot days in 30 yrs
- 14 days/yr
Wind risk 1/10 · Minimal
- Chance of severe wind over 30 yrs
- —
Air-quality risk 7/10 · Major
- Unhealthy air days now
- 13 days/yr
- Unhealthy air days in 30 yrs
- 14 days/yr
Risk factors via First Street. Map © Google.
Why this score? — see what drove the B- grade
The composite is a weighted blend of 9 inputs, each scored 0–100. Each bar is that input's sub-score; the figure is the points it added to the 100-point composite (weight × sub-score).
- Cash flow +26.3/30.0
- DSCR +8.9/10.0
- ARV discount +7.5/15.0
- 1% rule +6.8/10.0
- Schools +5.3/10.0
- Livability +3.9/5.0
- Rent growth +3.8/5.0
- Condition / age +2.5/5.0
- Appreciation +0.0/10.0
$7,500,000
🖨 Deal sheet 📄 Offer letter ✓ Due diligence
Multi-family units
County records classify this as Multi-Family (5+ Unit). Listing-text estimate: 20 units. confirmed
5+ unit building — per-unit beds/baths from public records are typically unavailable; the breakdown below (if shown) is an estimate from the listing text.
Listing remarks MLS
Offering memorandum available. Wonderful garden style 20-unit apartment community only 1.3 miles from Apple Park and 3 miles from Nvidia. (10) 2-Bed/1-Bath, (4) 1-Bed/1-Bath, (6) Studios. Building Size: 12,869 SqFt. Lot Size: 24,160 SqFt. Over $400,000 in recent CapEx: New Electrical Main & Interior Panels and 500A Service, New Roof with Transferable Warranty to Buyer, New Exterior Paint & Fascia, Copper Piping Replacements, Handrail Repairs & Catwalk Waterproofing & Dryrot Repairs Completed with full SB-721 Clearance, Water Heater, & Interior Renovations of Multiple Units. The property has wonderful garden style landscaping with a large courtyard & a swimming pool & lounge area. An ADU consultancy's report indicates there is the potential to add between 6 and 13 ADUs depending and # of parking spaces the buyer prefers (buyer to verify). Additional value add strategies include increasing rents & renovating units & adding dishwashers, installing in-unit laundry, & renovating with luxury finishes to need the demand of high income technology employees. The shortage of housing units, rent growth, & proximity to large Silicon Valley employers make 925 Pomeroy Ave a great opportunity for both the cash-flow and appreciation-minded investor.
Key facts
- Lounge area
- Swimming pool
- New electrical main
Tags
Neighborhood map
What this means for you Summary
Snapshot
- This is a 20 × 24-bed/20.0-bath units multifamily listed at $7.50M.
Deal economics
- At list price, monthly cash flow is $19k ($233k/yr) — positive. Per door: $969/mo.
- The deal already cash-flows at list — no discount required.
- Meets the 1% rule at list price ($88k rent vs $7.50M).
- Recommended offer: $7.28M (3.0% below list) — sets the bar for market timing.
- Cap rate 9.4% vs local median 1.3% in Santa Clara — top-decile yield for the area; either an underpriced asset or a hidden risk that comps aren't pricing in. Stress-test before assuming the spread holds.
Location & tenants
- Location reads 78/100 on livability (#69 in CA, #2,627 nationally) — a middle-class / working-renter tenant base. Strengths: amenities A+, commute A+, employment A+; Watch: cost of living F.
- Santa Clara Unified (urban): math 49% / reading 66% proficiency, ranked #75 of 517 in CA (top 14%) — acceptable for families but not a draw, mixed tenant base, ~2y average lease.
- Market conditions: Rents rising fast (+5.3%/yr); 100 active listings in the ZIP; high-income renter base; 3,838 units permitted in Santa Clara County in 2024 (1,886 in 5+ unit buildings).
- At $88,454/mo this rent would consume 540% of the median local household income ($197k/yr) (locally 1993% of renters already pay >50% of income on rent) — very limited rent-growth headroom before tenants either downsize or default.
Forward outlook
- Local home prices are declining (-3.0%/yr); year-one equity from $52k of loan paydown is wiped out by about $225k of value loss. Plan a longer hold.
- Santa Clara County population projected at +24% by 2050 — long-run rental-demand tailwind backs the buy-and-hold thesis.
- At projected returns (-3.0% appreciation + 5.3% rent growth), your $2.10M cash investment doubles in ~9 years — after that, you're playing with house money.
Negotiation context
- It's been on market 47 days — a 3% lower offer ($7.28M) is reasonable based on typical stale-listing flexibility.
- 16 sale attempts since 27y ago with the ask held roughly flat each time — persistent listings suggest the price (not the market) is what's stuck; bring a comps-based counter.
Risks & watch-outs
- Climate carrying-cost: extreme-heat days projected 7→14/yr by 2055 (HVAC capex compounding) — expect insurance premiums to compound above CPI over the hold.
Questions for the listing agent
- It's been on market 47 days. Have you received any prior offers? Is the seller open to a 3% concession, seller financing, or rate buy-down credit?
- Can we see the unit-by-unit rent roll, current vacancy, and any below-market leases? What's the average tenancy length?
- What capital expenditures (roof, boiler, parking lot, exteriors) have been made in the last 5 years, and what's planned in the next 2?
- Built in 1961 — when were the roof, HVAC, electrical panel, plumbing, and water heater last replaced?
- Is there a deadline driving the sale (1031 exchange, divorce, estate, relocation)? That informs how much negotiation room exists.
- Schools are B-rated — typically a magnet for longer-tenancy family renters. What's the average tenant stay here, and is there a school-zone premium baked into asking?
- What's the average days-on-market for RENTAL listings here right now (not sales)? A rising rental-DOM trend means longer vacancies and softer asking-rent achievability than the comps imply.
- What's the recent tenant-quality profile in this submarket — average credit score on applications, eviction rate, late-payment / NSF rate, and stable-employment percentage? A property-management company in the area should have these aggregated.
- How much new apartment / multifamily construction is in the pipeline within 1–3 miles? Heavy new supply (>2% of stock underway) typically softens rents 12–24 months out; light construction supports rent growth.
Investment metrics
- 1% rule
- 1.18% ✓
- Cap rate
- 9.39%
- Cash-on-cash
- 11.08%
- DSCR
- 1.49
- GRM
- 7.1
CMA / ARV
- ARV (median comp)
- $4,883,267
- List price
- $7,500,000
- Delta
- 53.59%
- Verdict
- OVERPRICED
- Comps
- 5 within 1.0 mi
Projected returns pro-forma
-3.0% appreciation · 5.33% rent growth · sell at horizon
- IRR
- 2.8%
- Equity multiple
- 1.11×
- Total profit
- $231,957
- Equity at exit
- $1,118,274
- IRR
- 14.5%
- Equity multiple
- 2.29×
- Total profit
- $2,707,060
- Equity at exit
- $648,463
Cash invested: $2,100,000 (down + closing). Projections, not guarantees.
Landlord ↔ Tenant lean methodology
- Overall (STATE)
- 18 Strongly Tenant-Friendly
- State California
- 18 Strongly Tenant-Friendly · D+13
- County
- — inherits STATE
- City
- — inherits STATE
ZIP-level market 95051
- Rents YoY
- 5.3%
- Active inventory
- 100
- Price-to-rent
- 141.3×
Monthly cashflow live
- Estimated rent
- $88,454 medium interval (Pro) →
- Mortgage (P&I)
- −$39,331
- Tax from tax record
- −$8,039 /mo · $96,465/yr
- Insurance
- −$3,125
- HOA
- −$0
- Vacancy / Maint / Mgmt
- −$18,575
- Net cashflow
- $19,384
Break-even live
20-unit breakdown (identical units grouped — click to expand)
| Units | Beds | Baths | Est. rent |
|---|---|---|---|
| 20× units | 24 | 20 | $88,460 |
| #1 | 24 | 20 | $4,423 |
| #2 | 24 | 20 | $4,423 |
| #3 | 24 | 20 | $4,423 |
| #4 | 24 | 20 | $4,423 |
| #5 | 24 | 20 | $4,423 |
| #6 | 24 | 20 | $4,423 |
| #7 | 24 | 20 | $4,423 |
| #8 | 24 | 20 | $4,423 |
| #9 | 24 | 20 | $4,423 |
| #10 | 24 | 20 | $4,423 |
| #11 | 24 | 20 | $4,423 |
| #12 | 24 | 20 | $4,423 |
| #13 | 24 | 20 | $4,423 |
| #14 | 24 | 20 | $4,423 |
| #15 | 24 | 20 | $4,423 |
| #16 | 24 | 20 | $4,423 |
| #17 | 24 | 20 | $4,423 |
| #18 | 24 | 20 | $4,423 |
| #19 | 24 | 20 | $4,423 |
| #20 | 24 | 20 | $4,423 |
| Total (20 units) | $88,454 | ||
UW: 25.0% down · 7.5% · 30yr · 1.5% tax · 5.0% vac · 8.0% maint · 8.0% mgmt
Financing live
Cash to close
- Down payment
- $1,875,000
- Closing costs
- $225,000
- Reserves months
- —
- Total cash needed
- —
Loan-product check · same deal, 3 products live
Conventional
25% down · 7.5% · 30yr
- Down + closing
- —
- Monthly P&I
- —
- Monthly cashflow
- —
- DSCR
- —
- Eligible?
- —
Personal DTI + credit; lowest rate.
DSCR
20% down · 8.5% · 30yr
- Down + closing
- —
- Monthly P&I
- —
- Monthly cashflow
- —
- DSCR
- —
- Eligible?
- —
No personal income docs; deal must DSCR.
Hard money
10% down · 12.0% · 12mo
- Down + closing
- —
- Monthly P&I
- —
- Monthly cashflow
- —
- DSCR
- —
- Eligible?
- —
Short-term bridge; refi at stabilization.
Listing history 50 events
-
2026-06-18days on market $7,500,000 Active 47 DOM
-
2026-06-17days on market $7,500,000 Active 46 DOM
-
2026-06-16days on market $7,500,000 Active 45 DOM
-
2026-06-15days on market $7,500,000 Active 44 DOM
-
2026-06-13days on market $7,500,000 Active 42 DOM
-
2026-06-13days on market $7,500,000 Active 41 DOM
-
2026-06-09days on market $7,500,000 Active 38 DOM
-
2026-06-08days on market $7,500,000 Active 37 DOM
-
2026-06-07days on market $7,500,000 Active 36 DOM
-
2026-06-05days on market $7,500,000 Active 33 DOM
-
2026-06-03days on market $7,500,000 Active 32 DOM
-
2026-06-02days on market $7,500,000 Active 31 DOM
-
2026-06-01days on market $7,500,000 Active 30 DOM
-
2026-05-31days on market $7,500,000 Active 29 DOM
-
2026-05-03historical
-
2026-05-02$7,500,000 Active 1316-char remark
Show marketing remark (1316 chars)
Offering memorandum available. Wonderful garden style 20-unit apartment community only 1.3 miles from Apple Park and 3 miles from Nvidia. (10) 2-Bed/1-Bath, (4) 1-Bed/1-Bath, (6) Studios. Building Size: 12,869 SqFt. Lot Size: 24,160 SqFt. Over $400,000 in recent CapEx: New Electrical Main & Interior Panels and 500A Service, New Roof with Transferable Warranty to Buyer, New Exterior Paint & Fascia, Copper Piping Replacements, Handrail Repairs & Catwalk Waterproofing & Dryrot Repairs Completed with full SB-721 Clearance, Water Heater, & Interior Renovations of Multiple Units. The property has wonderful garden style landscaping with a large courtyard & a swimming pool & lounge area. An ADU consultancy's report indicates there is the potential to add between 6 and 13 ADUs depending and # of parking spaces the buyer prefers (buyer to verify). Additional value add strategies include increasing rents & renovating units & adding dishwashers, installing in-unit laundry, & renovating with luxury finishes to need the demand of high income technology employees. The shortage of housing units, rent growth, & proximity to large Silicon Valley employers make 925 Pomeroy Ave a great opportunity for both the cash-flow and appreciation-minded investor.
-
2024-04-25historical $1,595
-
2024-04-16price $1,595
-
2024-04-11$1,695
-
2024-04-10historical $1,695
-
2024-03-19$1,695
-
2024-01-20historical $1,695
-
2024-01-11historical $1,695
-
2024-01-11$1,695
-
2024-01-11$1,695
-
2024-01-05historical $1,695
-
2024-01-05historical $1,695
-
2024-01-04$1,695
-
2023-11-29$1,695
-
2023-10-11historical $1,695
-
2023-10-04$1,695
-
2023-09-14historical
-
2017-05-15historical
-
2016-12-16soldstatus $7,000,000
-
2016-12-16soldstatus $7,000,000 Sold
-
2016-12-16soldstatus $7,000,000
-
2016-10-19status Pending (Do Not Show)
-
2016-08-31$7,000,000
-
2016-08-31$7,000,000 Active
-
2013-07-16soldstatus $4,050,000
-
2005-10-24$3,200,000
-
2002-06-19soldstatus $2,700,000
-
2002-06-19soldstatus $2,700,000
-
2002-06-19soldstatus $2,700,000
-
2002-05-14historical
-
2002-02-20$2,875,000
-
2002-02-20$2,875,000
-
2000-06-13soldstatus $2,650,000
-
1999-10-29soldstatus $2,190,000
ⓘ Source: listings_history table (triggers on properties + properties_extension) + one-shot
backfill from property_details.listing_events for pre-trigger history.
Tax reassessment forecast CA · Resets to sale price
- Current annual tax
- $96,465 · $8,039/mo
- Projected year-2 tax
- $96,465 · $8,039/mo
- Expected delta
- $0/yr ($0/mo · 0.0%)
ⓘ Screening estimate from a state-policy table — verify with the county assessor before closing.
Climate risk First Street
- Flood 1/10 Low FEMA zone X (shaded) · 0% chance over 30 yrs
- Wildfire 1/10 Low
- Heat 5/10 Major 7 d/yr ≥93°F today · 14 d/yr by 30 yrs out
- Wind 1/10 Low
- Air quality 7/10 Severe 13 unhealthy d/yr today · 14 by 30 yrs out
Nearby sold comps map
Loading sold comps map…
Walkable amenities ~0.75 mi
Loading nearby amenities…
Taxation est. · year 1
- Rental income
- $1,061,448
- − Mortgage interest
- −$420,117
- − Property taxes
- −$96,465
- − Insurance
- −$37,500
- − Repairs & maintenance
- −$84,916
- − Management
- −$84,916
- − Depreciation
- −$218,182
- Taxable income
- $119,353
- Est. tax owed @ 24.0%
- −$28,645
- After-tax cash flow
- $203,964/yr
For passive investors: Depreciation is non-cash, so a rental often shows a tax loss while cash-flowing — sheltering income. Rental losses are passive: they offset passive income freely, and up to $25,000/yr can offset ordinary (W-2) income if you actively participate and your MAGI is under $100k (phasing out to $0 by $150k); unused losses carry forward. On sale, claimed depreciation is recaptured at up to 25%, and gains may owe capital-gains tax (a 1031 exchange can defer both). Figures are a year-1 estimate at your 24.0% rate — not tax advice; consult a CPA.
Schools (NCES district)
- District
- Santa Clara Unified
- NCES district ID
- 0635430
- Math proficiency
- 49% ▼ -3.00%
- Reading proficiency
- 66% ▲ 4.00%
- Median HH income
- $97,320
- Composite
- 53.46/100
- National rank
- #1459
- State rank
- #75 of 517 in CA
Livability — Santa Clara
- Score
- 78/100
- State rank
- #69
- US rank
- #2627
Category grades
Schools grade is shown separately in the Schools card above.
Census & demographics
- Census place
- Santa Clara, CA
- County
- Santa Clara County · 1,806,974 people
- City population
- 127,592
- Metro
- San Jose-Sunnyvale-Santa Clara, CA
- Population (ZIP)
- 62,054
- Household income
- $196,690
- Rent vs Own
- Severe rent burden
- 1993.0
Population outlook (Santa Clara County) Hauer SSP2
- Today (2025)
- 2,179,074 people
- By 2030
- 2,301,297 · +5.6%
- By 2040
- 2,528,195 · +16.0%
- By 2050
- 2,712,135 · +24.5%
- By 2075
- 2,998,701 · +37.6%
- By 2100
- 2,931,429 · +34.5%
Race, ethnicity, and origin ACS 2023
- Neighborhood character
- Diverse neighborhood (Simpson 0.63)
- Race & ethnicity
- Asian 54% White 26% Hispanic / Latino 13% Two or more races 10% Black 1%
- Hispanic origin (detail)
- Mexican 9%
- Common ancestry
- Russian 2% Romanian 2% Italian 1%
- Foreign-born
- 49% · China, Canada, South Korea
- Languages at home
- 42% English-only · Chinese 16% Other Indo-European 14% Other Asian/Pacific 9%
Political lean MEDSL · Santa Clara
- 2024 margin
- Solid D (+40.0) · D 68.1% · R 28.1% · Other 3.8%
- 2008→2024 swing
- -0.9pp no change · 2008: 40.9pp · 2024: 40.0pp
- All cycles
- 2024: D+40.0 2020: D+47.4 2016: D+52.5 2012: D+42.1 2008: D+40.9
Not yet ingested
- Civics
- —
Market trends
- HPI YoY
- ▼ -1229.51%
- Current HPI
- 421.9119
- Rent YoY
- ▲ 5.33%
- Metro
- San Jose-Sunnyvale-Santa Clara, CA
- State GDP YoY
- ▲ 3.21%
- F500 in state
- 116
Industry mix (Fortune 500 HQ in CA)
| Industry | F500 HQs | Revenue |
|---|---|---|
| Technology | 27 | $1,492B |
|
||
| Financial Services | 3 | $174B |
|
||
| Retail | 3 | $44B |
|
||
| Insurance | 3 | $26B |
|
||
| Media / Entertainment | 2 | $115B |
|
||
| Pharmaceuticals / Biotech | 2 | $62B |
|
||
Price history
+971.4% since first listed42 events — show timeline
- 2026-05-03 Listing Removed — bridgeMLS, Bay East AOR, or Contra Costa AOR
- 2026-05-02 Listed $7,500,000 MLSListings
- 2026-05-02 Listed $7,500,000 bridgeMLS, Bay East AOR, or Contra Costa AOR
- 2024-04-25 Rental Removed $1,595 APPFOLIO
- 2024-04-16 Price Changed $1,595 APPFOLIO
- 2024-04-11 Listed for Rent $1,695 APPFOLIO
- 2024-04-10 Rental Removed $1,695 APPFOLIO
- 2024-03-19 Listed for Rent $1,695 APPFOLIO
- 2024-01-20 Rental Removed $1,695 APPFOLIO
- 2024-01-11 Rental Removed $1,695 APPFOLIO
- 2024-01-11 Listed for Rent $1,695 APPFOLIO
- 2024-01-11 Listed for Rent $1,695 APPFOLIO
- 2024-01-05 Rental Removed $1,695 APPFOLIO
- 2024-01-05 Rental Removed $1,695 APPFOLIO
- 2024-01-04 Listed for Rent $1,695 APPFOLIO
- 2023-11-29 Listed for Rent $1,695 APPFOLIO
- 2023-10-11 Rental Removed $1,695 APPFOLIO
- 2023-10-04 Listed for Rent $1,695 APPFOLIO
- 2023-09-14 Rental Removed — APPFOLIO
- 2017-05-15 Listing Removed — bridgeMLS, Bay East AOR, or Contra Costa AOR
- 2016-12-16 Sold (Public Records) $7,000,000 Public Records
- 2016-12-16 Sold (MLS) $7,000,000 MLSListings
- 2016-12-16 Sold (MLS) $7,000,000 bridgeMLS, Bay East AOR, or Contra Costa AOR
- 2016-10-19 Pending — MLSListings
- 2016-08-31 Listed $7,000,000 bridgeMLS, Bay East AOR, or Contra Costa AOR
- 2016-08-31 Listed $7,000,000 MLSListings
- 2013-07-16 Sold (Public Records) $4,050,000 Public Records
- 2005-10-24 Listed $3,200,000 San Francisco MLS
- 2002-06-19 Sold (Public Records) $2,700,000 Public Records
- 2002-06-19 Sold (MLS) $2,700,000 MLSListings
- 2002-06-19 Sold (MLS) $2,700,000 bridgeMLS, Bay East AOR, or Contra Costa AOR
- 2002-05-14 Listing Removed — MLSListings
- 2002-02-20 Listed $2,875,000 MLSListings
- 2002-02-20 Listed $2,875,000 bridgeMLS, Bay East AOR, or Contra Costa AOR
- 2000-06-13 Sold (Public Records) $2,650,000 Public Records
- 1999-10-29 Sold (Public Records) $2,060,000 Public Records
- 1999-10-29 Sold (MLS) $2,190,000 MLSListings
- 1999-10-29 Sold (MLS) $2,190,000 bridgeMLS, Bay East AOR, or Contra Costa AOR
- 1999-10-05 Listing Removed — MLSListings
- 1999-04-17 Listed $2,090,000 MLSListings
- 1999-04-17 Listed $2,090,000 bridgeMLS, Bay East AOR, or Contra Costa AOR
- 1978-08-01 Sold (Public Records) $700,000 Public Records
Property tax history
+6.2%/yrLatest (2025): $96,465 · +3.9% YoY. Source: county tax records.
Cash-flow waterfall
monthlySold comps — $/sqft
last 12 mo · ≤1 miLoading sold comps…