7139 Route 9
Rhinebeck, NY 12572
$265,000C+
3 bd · 2.0 ba ·
1,300 sqft ·
Built 1997
· Manufactured
· Active
· 1 DOM
Cashflow @ list (25.0% down · 7.5%)
Estimated rent
$3,498/mo
Mortgage (P&I)
−$1,390
Tax + insurance
−$442
HOA
−$520
Vac / Maint / Mgmt
−$735
Net cashflow
$412/mo
Annual
$4,943/yr
Cap rate
8.16%
Cash-on-cash
6.66%
DSCR
1.30
1% rule
1.32%
Cash to close
$74,200
Investor read
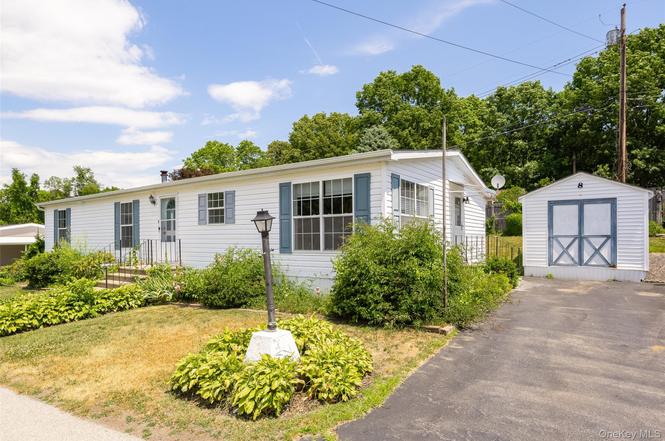
- This is a 3-bed/2.0-bath manufactured listed at $265k. Condition is rated good.
- At list price, monthly cash flow is $412 ($5k/yr) — positive.
- The deal already cash-flows at list — no discount required.
- Meets the 1% rule at list price ($3k rent vs $265k).
- Only 1 days on market — expect competitive offers; lowballing is unlikely to land.
- Local home prices are declining (-3.0%/yr); year-one equity from $2k of loan paydown is wiped out by about $8k of value loss. Plan a longer hold.
- Location reads 81/100 on livability (#91 in NY, #1,405 nationally) — a professional / high-income tenant draw. Strengths: crime A+, commute A+, health & safety A+; Watch: cost of living F.
- Rhinebeck Central School District (town): math 64% / reading 60% proficiency, ranked #221 of 755 in NY (top 29%) — acceptable for families but not a draw, mixed tenant base, ~2y average lease; only 11% free/reduced lunch — higher-income household profile.
- Zoned schools: Rhinebeck Senior High School (math 98% / reading 70%, grade A, #409 of 1,100 statewide, top 39%, 322 students, 18% FRL).
- Zoned-school proficiency averages 84% at this address vs 62% district-wide (+22 pts) — the actual schools serving this property are materially stronger than the Rhinebeck Central School District average implies; a family-tenant draw the district grade alone would hide.
- Market conditions: 91 active listings in the ZIP; 2 comparable units currently listed for rent nearby; solid renter incomes; 620 units permitted in Dutchess County in 2024 (242 in 5+ unit buildings).
- Dutchess County population projected at -11% by 2050 — secular population decline; favor cash flow + early exit over multi-decade hold.
- Cap rate 8.2% vs local median 2.3% in Rhinebeck — top-decile yield for the area; either an underpriced asset or a hidden risk that comps aren't pricing in. Stress-test before assuming the spread holds.
- This rent runs 44% of the median local income ($95k/yr) — at the standard rent-burdened threshold; future hikes will face affordability resistance.
Questions for listing agent
- What does the HOA fee cover, when was the last increase, and are there any pending special assessments or reserve-fund shortfalls?
- Is there a deadline driving the sale (1031 exchange, divorce, estate, relocation)? That informs how much negotiation room exists.
- Schools are A-rated — typically a magnet for longer-tenancy family renters. What's the average tenant stay here, and is there a school-zone premium baked into asking?
- What's the average days-on-market for RENTAL listings here right now (not sales)? A rising rental-DOM trend means longer vacancies and softer asking-rent achievability than the comps imply.
- What's the recent tenant-quality profile in this submarket — average credit score on applications, eviction rate, late-payment / NSF rate, and stable-employment percentage? A property-management company in the area should have these aggregated.
- How much new for-sale + rental construction is in the pipeline within 1–3 miles? Heavy new supply typically softens prices + rents 12–24 months out; constrained supply supports both.
CashFlowRE · CFR-YTXCE618JYBA10
· Data 2 days ago
cashflowre.app · 2026-05-29