7139 Route 9 · Rhinebeck, NY
Flood risk No data
- FEMA flood zone
- —
- Chance of flooding over 30 yrs
- —
- Est. flood insurance / yr
- —
Fire risk No data
- Est. fire insurance / yr
- —
Heat risk No data
- Hot days now (above threshold)
- —
- Hot days in 30 yrs
- —
Wind risk No data
- Chance of severe wind over 30 yrs
- —
Air-quality risk No data
- Unhealthy air days now
- —
- Unhealthy air days in 30 yrs
- —
Risk factors via First Street. Map © Google.
Why this score? — see what drove the C+ grade
The composite is a weighted blend of 9 inputs, each scored 0–100. Each bar is that input's sub-score; the figure is the points it added to the 100-point composite (weight × sub-score).
- Cash flow +21.8/30.0
- 1% rule +8.2/10.0
- ARV discount +7.5/15.0
- DSCR +7.0/10.0
- Schools +5.6/10.0
- Livability +4.0/5.0
- Condition / age +3.8/5.0
- Rent growth +2.5/5.0
- Appreciation +0.0/10.0
$265,000
🖨 Deal sheet 📄 Offer letter ✓ Due diligence
Listing remarks
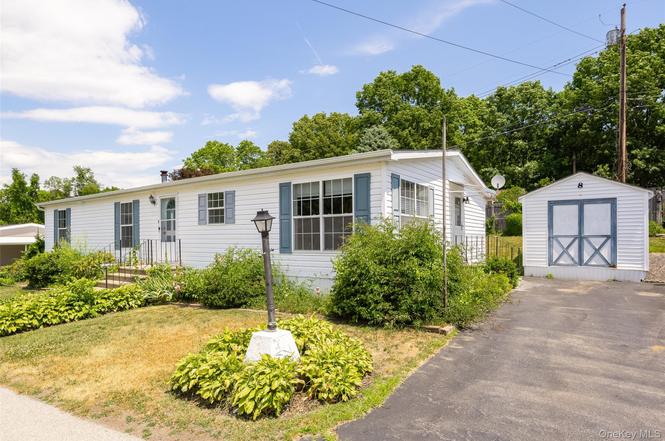
Move right into this immaculate and meticulously maintained 3-bedroom, 2-bath home in the desirable Lamplight Court 55+ community. Offering easy, low-maintenance living, this mint-condition home features a spacious floor plan, a private primary suite, and bright, inviting living spaces designed for comfort and convenience. Enjoy your morning coffee or entertain guests on the private deck overlooking the fenced backyard, perfect for gardening, pets, or relaxing outdoors. Nestled in a quiet, neat, and well-kept community in Red Hook, with a Rhinebeck mailing address, this home is ideally located just minutes from Hannaford, shopping, dining, and approximately six minutes from Northern Dutches
Key facts
- Private deck
- Convenient location
- Fenced backyard
Tags
Property features AI
Finance
- HOA & community: Has association; Monthly association fee of $520; Association covers sewer, water and snow removal; Association provides grounds maintenance; Located in a senior community
Exterior
- Parking: Driveway
- Utilities: Public sewer; Electricity connected (Central Hudson); Water connected; Cable connected
- Home design: Mobile home; One story
- Construction: Vinyl siding construction
- Exterior features: Vinyl siding; Not waterfront
Interior
- Kitchen: Dishwasher; Range; Refrigerator; Open kitchen with eat-in area
- Bedrooms: One-level (single story) home
- Bathrooms: 2 full bathrooms
- Heating & cooling: Oil heating; Central air conditioning
- Interior features: First-floor bedroom; First-floor full bathroom; Ceiling fans; Eat-in kitchen; Entrance foyer; Open floor plan; Open kitchen; Walk-in closets; Deck
- Laundry & utility: Washer; Dryer
Neighborhood map
What this means for you Summary
Snapshot
- This is a 3-bed/2.0-bath manufactured listed at $265k. Condition is rated good.
Deal economics
- At list price, monthly cash flow is $412 ($5k/yr) — positive.
- The deal already cash-flows at list — no discount required.
- Meets the 1% rule at list price ($3k rent vs $265k).
- Cap rate 8.2% vs local median 2.3% in Rhinebeck — top-decile yield for the area; either an underpriced asset or a hidden risk that comps aren't pricing in. Stress-test before assuming the spread holds.
Location & tenants
- Location reads 81/100 on livability (#91 in NY, #1,405 nationally) — a professional / high-income tenant draw. Strengths: crime A+, commute A+, health & safety A+; Watch: cost of living F.
- Rhinebeck Central School District (town): math 64% / reading 60% proficiency, ranked #221 of 755 in NY (top 29%) — acceptable for families but not a draw, mixed tenant base, ~2y average lease; only 11% free/reduced lunch — higher-income household profile.
- Zoned schools: Rhinebeck Senior High School (math 98% / reading 70%, grade A, #409 of 1,100 statewide, top 39%, 322 students, 18% FRL).
- Zoned-school proficiency averages 84% at this address vs 62% district-wide (+22 pts) — the actual schools serving this property are materially stronger than the Rhinebeck Central School District average implies; a family-tenant draw the district grade alone would hide.
- Market conditions: 91 active listings in the ZIP; 2 comparable units currently listed for rent nearby; solid renter incomes; 620 units permitted in Dutchess County in 2024 (242 in 5+ unit buildings).
- This rent runs 44% of the median local income ($95k/yr) — at the standard rent-burdened threshold; future hikes will face affordability resistance.
Forward outlook
- Local home prices are declining (-3.0%/yr); year-one equity from $2k of loan paydown is wiped out by about $8k of value loss. Plan a longer hold.
- Dutchess County population projected at -11% by 2050 — secular population decline; favor cash flow + early exit over multi-decade hold.
Negotiation context
- Only 1 days on market — expect competitive offers; lowballing is unlikely to land.
Questions for the listing agent
- What does the HOA fee cover, when was the last increase, and are there any pending special assessments or reserve-fund shortfalls?
- Is there a deadline driving the sale (1031 exchange, divorce, estate, relocation)? That informs how much negotiation room exists.
- Schools are A-rated — typically a magnet for longer-tenancy family renters. What's the average tenant stay here, and is there a school-zone premium baked into asking?
- What's the average days-on-market for RENTAL listings here right now (not sales)? A rising rental-DOM trend means longer vacancies and softer asking-rent achievability than the comps imply.
- What's the recent tenant-quality profile in this submarket — average credit score on applications, eviction rate, late-payment / NSF rate, and stable-employment percentage? A property-management company in the area should have these aggregated.
- How much new for-sale + rental construction is in the pipeline within 1–3 miles? Heavy new supply typically softens prices + rents 12–24 months out; constrained supply supports both.
Investment metrics
- 1% rule
- 1.32% ✓
- Cap rate
- 8.16%
- Cash-on-cash
- 6.66%
- DSCR
- 1.30
- GRM
- 6.3
CMA / ARV
No comps found within radius.
Projected returns pro-forma
-3.0% appreciation · 3.0% rent growth · sell at horizon
- IRR
- -5.9%
- Equity multiple
- 0.78×
- Total profit
- $-16,331
- Equity at exit
- $39,512
- IRR
- 3.9%
- Equity multiple
- 1.28×
- Total profit
- $21,077
- Equity at exit
- $22,912
Cash invested: $74,200 (down + closing). Projections, not guarantees.
Landlord ↔ Tenant lean methodology
- Overall (STATE)
- 15 Strongly Tenant-Friendly
- State New York
- 15 Strongly Tenant-Friendly · D+10
- County
- — inherits STATE
- City
- — inherits STATE
ZIP-level market 12572
- Home prices YoY
- -28.0%
- Active inventory
- 91
- Price-to-rent
- 6.3×
Monthly cashflow live
- Estimated rent
- $3,498 medium interval (Pro) →
- Mortgage (P&I)
- −$1,390
- Tax est. 1.5%
- −$331 /mo · $3,975/yr
- Insurance
- −$110
- HOA
- −$520
- Vacancy / Maint / Mgmt
- −$735
- Net cashflow
- $412
Break-even live
UW: 25.0% down · 7.5% · 30yr · 1.5% tax · 5.0% vac · 8.0% maint · 8.0% mgmt
Financing live
Cash to close
- Down payment
- $66,250
- Closing costs
- $7,950
- Reserves months
- —
- Total cash needed
- —
Loan-product check · same deal, 3 products live
Conventional
25% down · 7.5% · 30yr
- Down + closing
- —
- Monthly P&I
- —
- Monthly cashflow
- —
- DSCR
- —
- Eligible?
- —
Personal DTI + credit; lowest rate.
DSCR
20% down · 8.5% · 30yr
- Down + closing
- —
- Monthly P&I
- —
- Monthly cashflow
- —
- DSCR
- —
- Eligible?
- —
No personal income docs; deal must DSCR.
Hard money
10% down · 12.0% · 12mo
- Down + closing
- —
- Monthly P&I
- —
- Monthly cashflow
- —
- DSCR
- —
- Eligible?
- —
Short-term bridge; refi at stabilization.
Rent comps 2 comps
| Address | Beds | Baths | Sqft | Rent | $/sqft | DOM | Units | Dist |
|---|---|---|---|---|---|---|---|---|
| 9 Village Grn Rhinebeck, NY | 2.0 | 1.0 | 1240 | $2,488 | $2.01 | 14d | 1 | 0.98mi |
| 257 Mill Rd Rhinebeck, NY | 2.0 | 2.0 | 1324 | $4,000 | $3.02 | 23d | 1 | 1.28mi |
HOA detail
- Monthly dues
- $520 · $6,240/yr
Listing history 2 events
-
2026-06-18remarks 699-char remark
-
2026-06-18$265,000 Active 1 DOM
ⓘ Source: listings_history table (triggers on properties + properties_extension) + one-shot
backfill from property_details.listing_events for pre-trigger history.
Nearby sold comps map
Loading sold comps map…
Walkable amenities ~0.75 mi
Loading nearby amenities…
Taxation est. · year 1
- Rental income
- $41,974
- − Mortgage interest
- −$14,844
- − Property taxes
- −$3,975
- − Insurance
- −$1,325
- − Repairs & maintenance
- −$3,358
- − Management
- −$3,358
- − HOA
- −$6,240
- − Depreciation
- −$7,709
- Taxable income
- $1,165
- Est. tax owed @ 24.0%
- −$280
- After-tax cash flow
- $4,664/yr
For passive investors: Depreciation is non-cash, so a rental often shows a tax loss while cash-flowing — sheltering income. Rental losses are passive: they offset passive income freely, and up to $25,000/yr can offset ordinary (W-2) income if you actively participate and your MAGI is under $100k (phasing out to $0 by $150k); unused losses carry forward. On sale, claimed depreciation is recaptured at up to 25%, and gains may owe capital-gains tax (a 1031 exchange can defer both). Figures are a year-1 estimate at your 24.0% rate — not tax advice; consult a CPA.
Condition & rehab AI · 13 photos
This well-maintained mobile home in a desirable community offers a good investment opportunity with minor updates that can significantly enhance its value.
Value-add opportunities
- Resale Paint the exterior siding — Fresh paint enhances curb appeal and property value.
- Both Replace carpet with hardwood or tile flooring — Hardwood or tile flooring is more durable and adds value to the home.
- Rental Clean and maintain the HVAC system — A clean and well-maintained HVAC system ensures comfort and reduces maintenance costs for tenants.
Renovation cost estimate screening
Value-add ROI direction
- Resale Paint the exterior siding — Fresh paint enhances curb appeal and property value. ↑
- Both Replace carpet with hardwood or tile flooring — Hardwood or tile flooring is more durable and adds value to the home. ↑
- Rental Clean and maintain the HVAC system — A clean and well-maintained HVAC system ensures comfort and reduces maintenance costs for tenants. ↑
ⓘ Cost ranges are severity-bucket heuristics (US national rule-of-thumb). Get contractor quotes + a written scope before underwriting a rehab budget.
Schools (NCES district)
- District
- Rhinebeck Central School District
- NCES district ID
- 3624480
- Math proficiency
- 64% ▬ 0.00%
- Reading proficiency
- 60% ▬ 0.00%
- Median HH income
- $71,819
- Composite
- 56.35/100
- National rank
- #2481
- State rank
- #221 of 755 in NY
Livability — Rhinebeck
- Score
- 81/100
- State rank
- #91
- US rank
- #1405
Category grades
Schools grade is shown separately in the Schools card above.
Census & demographics
- County
- Dutchess County · 188,048 people
- City population
- 8,869
- Metro
- Poughkeepsie-Newburgh-Middletown, NY
- Population (ZIP)
- 8,869
- Household income
- $94,859
- Rent vs Own
- Severe rent burden
- 172.0
Population outlook (Dutchess County) Hauer SSP2
- Today (2025)
- 291,768 people
- By 2030
- 287,131 · -1.6%
- By 2040
- 274,881 · -5.8%
- By 2050
- 259,971 · -10.9%
- By 2075
- 235,366 · -19.3%
- By 2100
- 208,786 · -28.4%
Race, ethnicity, and origin ACS 2023
- Neighborhood character
- Predominantly White (85%)
- Race & ethnicity
- White 85% Hispanic / Latino 8% Two or more races 6% Asian 2% Black 2%
- Hispanic origin (detail)
- Mexican 2% Puerto Rican 2%
- Common ancestry
- Scotch-Irish 4% Iranian 3% Romanian 3%
- Foreign-born
- 7% · Canada, China, Guatemala
- Languages at home
- 92% English-only · Spanish 3% German/W. Germanic 1% Russian/Polish/Slavic 1%
Political lean MEDSL · Dutchess
- 2024 margin
- Lean D (+5.4) · D 52.7% · R 47.3%
- 2008→2024 swing
- -3.2pp toward R · 2008: 8.6pp · 2024: 5.4pp
- All cycles
- 2024: D+5.4 2020: D+9.6 2016: R+1.1 2012: D+6.6 2008: D+8.6
Not yet ingested
- Civics
- —
Market trends
- HPI YoY
- ▼ -124.91%
- Current HPI
- 321.5995
- Rent YoY
- —
- Metro
- Poughkeepsie-Newburgh-Middletown, NY
- State GDP YoY
- ▲ 2.60%
- F500 in state
- 92
Industry mix (Fortune 500 HQ in NY)
| Industry | F500 HQs | Revenue |
|---|---|---|
| Financial Services | 10 | $950B |
|
||
| Consumer Goods | 9 | $162B |
|
||
| Insurance | 4 | $225B |
|
||
| Telecommunications | 2 | $144B |
|
||
| Pharmaceuticals | 2 | $112B |
|
||
| Media / Entertainment | 2 | $69B |
|
||
Price history
1 event — show timeline
- 2026-06-17 Listed $265,000 OneKey® MLS as Distributed by MLS Grid
Cash-flow waterfall
monthlySold comps — $/sqft
last 12 mo · ≤1 miLoading sold comps…