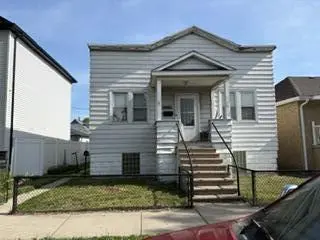
1437 121st St
Whiting, IN 46394
$195,500B
2 bd · 2.0 ba ·
1,755 sqft ·
Built 1922
· MultiFamily
· Pending
· 5 DOM
Cashflow @ list (25.0% down · 7.5%)
Estimated rent
$2,634/mo
Mortgage (P&I)
−$1,025
Tax + insurance
−$369
HOA
−$0
Vac / Maint / Mgmt
−$553
Net cashflow
$687/mo
Annual
$8,242/yr
Cap rate
10.51%
Cash-on-cash
15.06%
DSCR
1.67
1% rule
1.35%
Cash to close
$54,740
Investor read
- This is a 1×2bd/1.0ba + 1×3bd/1.0ba units multifamily listed at $196k.
- At list price, monthly cash flow is $687 ($8k/yr) — positive. Per door: $343/mo.
- The deal already cash-flows at list — no discount required.
- Meets the 1% rule at list price ($3k rent vs $196k).
- Only 5 days on market — expect competitive offers; lowballing is unlikely to land.
- In year one you build about $14k of equity ($1k loan paydown + $13k appreciation (6.6% local appreciation)).
- Location reads 63/100 on livability (#447 in IN) — a middle-class / working-renter tenant base. Strengths: cost of living A+, housing A+; Watch: crime C-, employment C-, amenities F.
- School City Of Whiting (suburban): math 15% / reading 43% proficiency, ranked #244 of 301 in IN (top 81%) — low school quality limits family demand, transient renter base, plan for 1-2y turnover.
- Zoned schools: Nathan Hale Elementary School (math 23% / reading 39%, grade F, #682 of 994 statewide, top 69%, 391 students, 78% FRL); Whiting Middle School (math 10% / reading 37%, grade F, #257 of 330 statewide, top 79%, 270 students, 78% FRL); Whiting High School (math 12% / reading 62%, grade F, #247 of 369 statewide, top 70%, 441 students, 68% FRL) — zoned schools average 75% FRL vs 58% district-wide (17 pts higher); higher-poverty schools than district average — tighter screening recommended.
- Watch-outs: built in 1922 — expect roof / HVAC / electrical / plumbing capex.
- Market conditions: 39 active listings in the ZIP; 1,642 units permitted in Lake County in 2024 (14 in 5+ unit buildings).
- Lake County population projected to shrink 7% by 2050 — rents likely to lag national; underwrite the cash flow, not the appreciation.
- At projected returns (6.6% appreciation + 3.0% rent growth), your $55k cash investment doubles in ~3 years — after that, you're playing with house money.
- By year 3, paydown + projected appreciation supports a ~$36k cash-out refi (75% LTV) — recoverable capital for the next deal without selling this one.
- At $2,634/mo this rent would consume 48% of the median local household income ($66k/yr) (locally 366% of renters already pay >50% of income on rent) — very limited rent-growth headroom before tenants either downsize or default.
Questions for listing agent
- Can we see the unit-by-unit rent roll, current vacancy, and any below-market leases? What's the average tenancy length?
- What capital expenditures (roof, boiler, parking lot, exteriors) have been made in the last 5 years, and what's planned in the next 2?
- Built in 1922 — when were the roof, HVAC, electrical panel, plumbing, and water heater last replaced?
- Is there a deadline driving the sale (1031 exchange, divorce, estate, relocation)? That informs how much negotiation room exists.
- Schools are F-rated, which usually means shorter tenancies and higher turnover. Who's the typical renter profile here, and what's been the actual vacancy rate?
- What's the average days-on-market for RENTAL listings here right now (not sales)? A rising rental-DOM trend means longer vacancies and softer asking-rent achievability than the comps imply.
- What's the recent tenant-quality profile in this submarket — average credit score on applications, eviction rate, late-payment / NSF rate, and stable-employment percentage? A property-management company in the area should have these aggregated.
- How much new apartment / multifamily construction is in the pipeline within 1–3 miles? Heavy new supply (>2% of stock underway) typically softens rents 12–24 months out; light construction supports rent growth.
CashFlowRE · CFR-YYEM821HE4KYTC
· Data 1 week ago
cashflowre.app · 2026-05-29