 Duplex
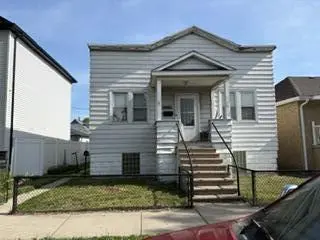
1437 121st St · Whiting, IN
Flood risk 1/10 · Minimal
- FEMA flood zone
- X (unshaded)
- Chance of flooding over 30 yrs
- 0.0%
- Est. flood insurance / yr
- $473 – $860
Fire risk 1/10 · Minimal
- Est. fire insurance / yr
- $717 – $1,331
Heat risk 3/10 · Minor
- Hot days now (above 101°F)
- 7 days/yr
- Hot days in 30 yrs
- 15 days/yr
Wind risk 2/10 · Minimal
- Chance of severe wind over 30 yrs
- —
Air-quality risk 4/10 · Minor
- Unhealthy air days now
- 4 days/yr
- Unhealthy air days in 30 yrs
- 5 days/yr
Risk factors via First Street. Map © Google.
Why this score? — see what drove the B grade
The composite is a weighted blend of 9 inputs, each scored 0–100. Each bar is that input's sub-score; the figure is the points it added to the 100-point composite (weight × sub-score).
- Cash flow +29.3/30.0
- DSCR +10.0/10.0
- 1% rule +8.5/10.0
- Appreciation +8.3/10.0
- ARV discount +7.5/15.0
- Livability +3.2/5.0
- Rent growth +2.5/5.0
- Schools +2.5/10.0
- Condition / age +2.5/5.0
$195,500
🖨 Deal sheet 📄 Offer letter ✓ Due diligence
Multi-family units
County records classify this as Multi-Family (2-4 Unit). Listing-text estimate: 2 units. confirmed
Listing remarks
1st time offered by the long term owner. Come take a look at this Whiting proper 2 unit Front Unit features 2 bedrooms, a full bath, living room, dining room and kitchen. One can enjoy the view from the covered front porch as you relax and watch the world go by. Back Unit features 3 bedrooms, a full bath, living room, dining room and kitchen. This unit has access to a rear wood deck . Enjoy dining on a nice evening or relaxing with a good book or whatever is your pleasure. The tenants pay the following utilities: heating (gas boiler heat), cooking gas and electric. The owner pays the following utilities water, sewage and recycling. Call NOW to view this property
Key facts
- Covered front porch
- Rear wood deck
- 4,902 sq ft lot
Tags
Property features AI
Exterior
- Parking: Detached garage; Alley access; On-street parking; 2 garage spaces
- Utilities: Electricity connected; Natural gas connected; Public water; Public sewer
- Home design: Built in 1922; Single-story property
- Construction: Asphalt roof
- Exterior features: Covered front porch; Porch and deck; Neighborhood view; Garage(s) on property
Interior
- Kitchen: Gas range; Refrigerator
- Bedrooms: Two-unit property: one 2-bedroom unit and one 3-bedroom unit
- Flooring: Carpet; Vinyl
- Bathrooms: Two full bathrooms (total)
- Heating & cooling: Hot water heating (natural gas); Individual cooling units; Ceiling fans for cooling
- Interior features: Ceiling fans; Laminate counters; Full unfinished walk-out basement
- Laundry & utility: Washer and dryer included; Washer hookup; Gas dryer hookup; Gas water heater
Neighborhood map
What this means for you Summary
Snapshot
- This is a 1×2bd/1.0ba + 1×3bd/1.0ba units multifamily listed at $196k.
Deal economics
- At list price, monthly cash flow is $687 ($8k/yr) — positive. Per door: $343/mo.
- The deal already cash-flows at list — no discount required.
- Meets the 1% rule at list price ($3k rent vs $196k).
Location & tenants
- Location reads 63/100 on livability (#447 in IN) — a middle-class / working-renter tenant base. Strengths: cost of living A+, housing A+; Watch: crime C-, employment C-, amenities F.
- School City Of Whiting (suburban): math 15% / reading 43% proficiency, ranked #244 of 301 in IN (top 81%) — low school quality limits family demand, transient renter base, plan for 1-2y turnover.
- Zoned schools: Nathan Hale Elementary School (math 23% / reading 39%, grade F, #682 of 994 statewide, top 69%, 391 students, 78% FRL); Whiting Middle School (math 10% / reading 37%, grade F, #257 of 330 statewide, top 79%, 270 students, 78% FRL); Whiting High School (math 12% / reading 62%, grade F, #247 of 369 statewide, top 70%, 441 students, 68% FRL) — zoned schools average 75% FRL vs 58% district-wide (17 pts higher); higher-poverty schools than district average — tighter screening recommended.
- Market conditions: 39 active listings in the ZIP; 1,642 units permitted in Lake County in 2024 (14 in 5+ unit buildings).
- At $2,634/mo this rent would consume 48% of the median local household income ($66k/yr) (locally 366% of renters already pay >50% of income on rent) — very limited rent-growth headroom before tenants either downsize or default.
Forward outlook
- In year one you build about $14k of equity ($1k loan paydown + $13k appreciation (6.6% local appreciation)).
- Lake County population projected to shrink 7% by 2050 — rents likely to lag national; underwrite the cash flow, not the appreciation.
- At projected returns (6.6% appreciation + 3.0% rent growth), your $55k cash investment doubles in ~3 years — after that, you're playing with house money.
- By year 3, paydown + projected appreciation supports a ~$36k cash-out refi (75% LTV) — recoverable capital for the next deal without selling this one.
Negotiation context
- Only 5 days on market — expect competitive offers; lowballing is unlikely to land.
Risks & watch-outs
- Watch-outs: built in 1922 — expect roof / HVAC / electrical / plumbing capex.
Questions for the listing agent
- Can we see the unit-by-unit rent roll, current vacancy, and any below-market leases? What's the average tenancy length?
- What capital expenditures (roof, boiler, parking lot, exteriors) have been made in the last 5 years, and what's planned in the next 2?
- Built in 1922 — when were the roof, HVAC, electrical panel, plumbing, and water heater last replaced?
- Is there a deadline driving the sale (1031 exchange, divorce, estate, relocation)? That informs how much negotiation room exists.
- Schools are F-rated, which usually means shorter tenancies and higher turnover. Who's the typical renter profile here, and what's been the actual vacancy rate?
- What's the average days-on-market for RENTAL listings here right now (not sales)? A rising rental-DOM trend means longer vacancies and softer asking-rent achievability than the comps imply.
- What's the recent tenant-quality profile in this submarket — average credit score on applications, eviction rate, late-payment / NSF rate, and stable-employment percentage? A property-management company in the area should have these aggregated.
- How much new apartment / multifamily construction is in the pipeline within 1–3 miles? Heavy new supply (>2% of stock underway) typically softens rents 12–24 months out; light construction supports rent growth.
Investment metrics
- 1% rule
- 1.35% ✓
- Cap rate
- 10.51%
- Cash-on-cash
- 15.06%
- DSCR
- 1.67
- GRM
- 6.2
CMA / ARV
No comps found within radius.
Projected returns pro-forma
6.63% appreciation · 3.0% rent growth · sell at horizon
- IRR
- 29.2%
- Equity multiple
- 2.97×
- Total profit
- $107,668
- Equity at exit
- $130,783
- IRR
- 26.8%
- Equity multiple
- 6.13×
- Total profit
- $280,907
- Equity at exit
- $244,291
Cash invested: $54,740 (down + closing). Projections, not guarantees.
Landlord ↔ Tenant lean methodology
- Overall (STATE)
- 90 Strongly Landlord-Friendly
- State Indiana
- 90 Strongly Landlord-Friendly · R+11
- County
- — inherits STATE
- City
- — inherits STATE
ZIP-level market 46394
- Home prices YoY
- 2.1%
- Active inventory
- 39
- Price-to-rent
- 13.2×
Monthly cashflow live
- Estimated rent
- $2,634 high interval (Pro) →
- Mortgage (P&I)
- −$1,025
- Tax from tax record
- −$287 /mo · $3,448/yr
- Insurance
- −$81
- HOA
- −$0
- Vacancy / Maint / Mgmt
- −$553
- Net cashflow
- $687
Break-even live
2-unit breakdown (identical units grouped — click to expand)
| Units | Beds | Baths | Est. rent |
|---|---|---|---|
| 1× unit | 2 | 1 | $1,231 |
| 1× unit | 3 | 1 | $1,403 |
| Total (2 units) | $2,634 | ||
UW: 25.0% down · 7.5% · 30yr · 1.5% tax · 5.0% vac · 8.0% maint · 8.0% mgmt
Financing live
Cash to close
- Down payment
- $48,875
- Closing costs
- $5,865
- Reserves months
- —
- Total cash needed
- —
Loan-product check · same deal, 3 products live
Conventional
25% down · 7.5% · 30yr
- Down + closing
- —
- Monthly P&I
- —
- Monthly cashflow
- —
- DSCR
- —
- Eligible?
- —
Personal DTI + credit; lowest rate.
DSCR
20% down · 8.5% · 30yr
- Down + closing
- —
- Monthly P&I
- —
- Monthly cashflow
- —
- DSCR
- —
- Eligible?
- —
No personal income docs; deal must DSCR.
Hard money
10% down · 12.0% · 12mo
- Down + closing
- —
- Monthly P&I
- —
- Monthly cashflow
- —
- DSCR
- —
- Eligible?
- —
Short-term bridge; refi at stabilization.
Listing history 5 events
-
2026-06-10status $195,500 Pending 5 DOM
-
2026-06-09days on market $195,500 Active 5 DOM
-
2026-06-08days on market $195,500 Active 4 DOM
-
2026-06-07remarks 672-char remark
-
2026-06-07$195,500 Active 3 DOM
ⓘ Source: listings_history table (triggers on properties + properties_extension) + one-shot
backfill from property_details.listing_events for pre-trigger history.
Tax reassessment forecast IN · Partial reset (capped growth)
- Current annual tax
- $3,448 · $287/mo
- Projected year-2 tax
- $3,448 · $287/mo
- Expected delta
- $0/yr ($0/mo · 0.0%)
ⓘ Screening estimate from a state-policy table — verify with the county assessor before closing.
Climate risk First Street
- Flood 1/10 Low FEMA zone X (unshaded) · 0% chance over 30 yrs
- Wildfire 1/10 Low
- Heat 3/10 Moderate 7 d/yr ≥101°F today · 15 d/yr by 30 yrs out
- Wind 2/10 Low
- Air quality 4/10 Moderate 4 unhealthy d/yr today · 5 by 30 yrs out
Nearby sold comps map
Loading sold comps map…
Walkable amenities ~0.75 mi
Loading nearby amenities…
Taxation est. · year 1
- Rental income
- $31,608
- − Mortgage interest
- −$10,951
- − Property taxes
- −$3,448
- − Insurance
- −$978
- − Repairs & maintenance
- −$2,529
- − Management
- −$2,529
- − Depreciation
- −$5,687
- Taxable income
- $5,487
- Est. tax owed @ 24.0%
- −$1,317
- After-tax cash flow
- $6,925/yr
For passive investors: Depreciation is non-cash, so a rental often shows a tax loss while cash-flowing — sheltering income. Rental losses are passive: they offset passive income freely, and up to $25,000/yr can offset ordinary (W-2) income if you actively participate and your MAGI is under $100k (phasing out to $0 by $150k); unused losses carry forward. On sale, claimed depreciation is recaptured at up to 25%, and gains may owe capital-gains tax (a 1031 exchange can defer both). Figures are a year-1 estimate at your 24.0% rate — not tax advice; consult a CPA.
Schools (NCES district)
- District
- School City Of Whiting
- NCES district ID
- 1813200
- Math proficiency
- 15% ▼ -15.00%
- Reading proficiency
- 43% ▼ -5.00%
- Median HH income
- $48,365
- Composite
- 25.1/100
- National rank
- #7530
- State rank
- #244 of 301 in IN
Livability — Whiting
- Score
- 63/100
- State rank
- #447
- US rank
- #15882
Category grades
Schools grade is shown separately in the Schools card above.
Census & demographics
- Census place
- Whiting, IN
- County
- Lake County · 422,878 people
- City population
- 11,894
- Metro
- Chicago-Naperville-Elgin, IL-IN-WI
- Population (ZIP)
- 11,894
- Household income
- $66,176
- Rent vs Own
- Severe rent burden
- 366.0
Population outlook (Lake County) Hauer SSP2
- Today (2025)
- 484,026 people
- By 2030
- 478,091 · -1.2%
- By 2040
- 462,974 · -4.3%
- By 2050
- 449,894 · -7.1%
- By 2075
- 436,169 · -9.9%
- By 2100
- 426,607 · -11.9%
Race, ethnicity, and origin ACS 2023
- Neighborhood character
- Diverse neighborhood (Simpson 0.58)
- Race & ethnicity
- White 48% Hispanic / Latino 43% Two or more races 10% Black 7% Native American 4%
- Hispanic origin (detail)
- Mexican 38% Puerto Rican 5%
- Common ancestry
- Romanian 12% Lithuanian 3% Slovak 1%
- Foreign-born
- 10% · Canada
- Languages at home
- 75% English-only · Spanish 23% Arabic 1%
Political lean MEDSL · Lake
- 2024 margin
- Lean D (+5.6) · D 52.1% · R 46.5% · Other 1.5%
- 2008→2024 swing
- -28.6pp toward R · 2008: 34.3pp · 2024: 5.6pp
- All cycles
- 2024: D+5.6 2020: D+15.1 2016: D+20.6 2012: D+31.0 2008: D+34.3
Not yet ingested
- Civics
- —
Market trends
- HPI YoY
- ▲ 6.63%
- Current HPI
- 327.0867
- Rent YoY
- —
- Metro
- Chicago-Naperville-Elgin, IL-IN-WI
- State GDP YoY
- ▲ 2.90%
- F500 in state
- 18
Industry mix (Fortune 500 HQ in IN)
| Industry | F500 HQs | Revenue |
|---|---|---|
| Industrial Machinery | 2 | $37B |
|
||
| Healthcare | 1 | $177B |
|
||
| Pharmaceuticals | 1 | $45B |
|
||
| Metals / Steel | 1 | $18B |
|
||
| Agriculture | 1 | $17B |
|
||
| Packaging | 1 | $12B |
|
||
Price history
1 event — show timeline
- 2026-06-02 Listed $195,500 NIRA MLS as Distributed by MLS Grid
Property tax history
+0.7%/yrLatest (2024): $3,448 · +6.2% YoY. Source: county tax records.
Cash-flow waterfall
monthlySold comps — $/sqft
last 12 mo · ≤1 miLoading sold comps…