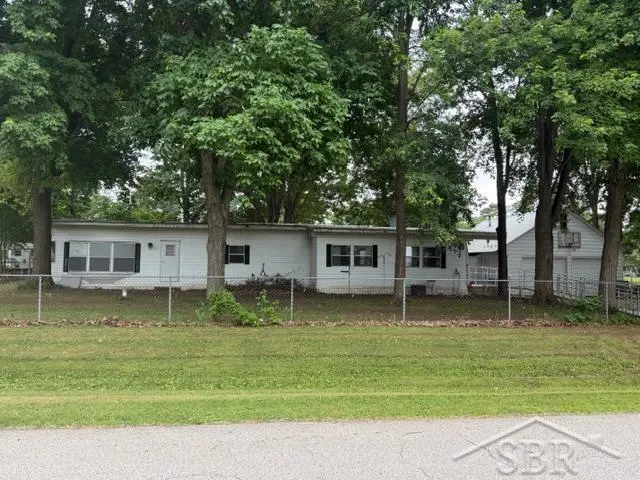
8709 Pine Ct
Arbela, MI 48420
$139,900D-
2 bd · 1.0 ba ·
1,028 sqft ·
Built 1979
· SingleFamily
· Active
· 11 DOM
Cashflow @ list (25.0% down · 7.5%)
Estimated rent
$1,023/mo
Mortgage (P&I)
−$734
Tax + insurance
−$85
HOA
−$0
Vac / Maint / Mgmt
−$215
Net cashflow
$-10/mo
Annual
$-118/yr
Cap rate
6.21%
Cash-on-cash
-0.30%
DSCR
0.99
1% rule
0.73%
Cash to close
$39,172
Investor read
- This is a 2-bed/1.0-bath single-family listed at $140k.
- At list price, monthly cash flow is $-10 ($-118/yr) — negative.
- To cash-flow at today's rent, offer at most $138k (1.2% below list).
- To meet the 1% rule (rent ≥ 1% of price), the offer needs to be $102k (26.8% below list).
- Only 11 days on market — expect competitive offers; lowballing is unlikely to land.
- Recommended offer: $102k (26.8% below list) — sets the bar for 1% rule.
- Local home prices are declining (-3.0%/yr); year-one equity from $967 of loan paydown is wiped out by about $4k of value loss. Plan a longer hold.
- Location reads: area grade D — affects rentability + tenant quality, not the cash-flow math above.
- Millington Community Schools (rural): math 23% / reading 37% proficiency, ranked #355 of 540 in MI (top 66%) — families likely to look elsewhere, expect single-tenant / working-renter base with shorter leases.
- Zoned schools: Meachum Elementary (math 17% / reading 27%, grade F, #1,035 of 1,397 statewide, top 77%, 472 students, 58% FRL); Millington Junior High School (math 17% / reading 42%, grade F, #343 of 493 statewide, top 72%, 222 students, 54% FRL); Millington High School (math 54% / reading 74%, grade B-, #46 of 713 statewide, top 7%, 384 students, 54% FRL).
- Market conditions: 154 active listings in the ZIP; 56 units permitted in Tuscola County in 2024 (0 in 5+ unit buildings).
- Tuscola County population projected at -29% by 2050 — secular population decline; favor cash flow + early exit over multi-decade hold.
- 8 sale attempts since 8y ago with the ask held roughly flat each time — persistent listings suggest the price (not the market) is what's stuck; bring a comps-based counter.
- Current owner paid $115k; 22% above their basis — modest negotiation headroom, anchor on the comps not their cost.
Questions for listing agent
- What do current leases actually rent for vs. the listed asking? Can we see a recent rent roll and the last 12 months of T-12 income?
- Built in 1979 — when were the roof, HVAC, electrical panel, plumbing, and water heater last replaced?
- Is there a deadline driving the sale (1031 exchange, divorce, estate, relocation)? That informs how much negotiation room exists.
- The area grade is low — what's the realistic commute time and amenity access for the typical tenant pool here? Any planned neighborhood developments (good or bad) we should know about?
- What's the average days-on-market for RENTAL listings here right now (not sales)? A rising rental-DOM trend means longer vacancies and softer asking-rent achievability than the comps imply.
- What's the recent tenant-quality profile in this submarket — average credit score on applications, eviction rate, late-payment / NSF rate, and stable-employment percentage? A property-management company in the area should have these aggregated.
- How much new for-sale + rental construction is in the pipeline within 1–3 miles? Heavy new supply typically softens prices + rents 12–24 months out; constrained supply supports both.
CashFlowRE · CFR-YYFYB781FJWJ1J
· Data 9 h ago
cashflowre.app · 2026-05-29