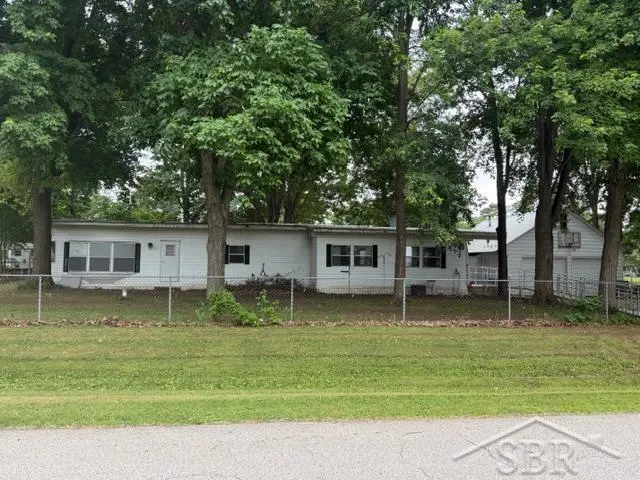
8709 Pine Ct · Arbela, MI
Flood risk 1/10 · Minimal
- FEMA flood zone
- X (unshaded)
- Chance of flooding over 30 yrs
- 0.0%
- Est. flood insurance / yr
- $473 – $860
Fire risk 3/10 · Minor
- Est. fire insurance / yr
- $784 – $1,456
Heat risk 2/10 · Minimal
- Hot days now (above 97°F)
- 7 days/yr
- Hot days in 30 yrs
- 14 days/yr
Wind risk 1/10 · Minimal
- Chance of severe wind over 30 yrs
- —
Air-quality risk 2/10 · Minimal
- Unhealthy air days now
- 1 days/yr
- Unhealthy air days in 30 yrs
- 3 days/yr
Risk factors via First Street. Map © Google.
Why this score? — see what drove the D- grade
The composite is a weighted blend of 9 inputs, each scored 0–100. Each bar is that input's sub-score; the figure is the points it added to the 100-point composite (weight × sub-score).
- Cash flow +12.9/30.0
- ARV discount +8.1/15.0
- DSCR +3.9/10.0
- Schools +2.6/10.0
- Rent growth +2.5/5.0
- Livability +2.5/5.0
- Condition / age +2.5/5.0
- 1% rule +2.3/10.0
- Appreciation +0.0/10.0
$139,900
🖨 Deal sheet (PDF) 📄 Offer letter ✓ Due diligence
Listing remarks MLS
Meticulously updated Holly Park Manufactured home (14 x 70 home with a 24 x 7 expansion and a 12 x 8 utility room added on. Most everything has been updated within the last 4 years. This includes new water heater, water softener, bladder, sump pump and piping in sump well. The bathroom features a new counter top, sinks, tub/shower combo and toilet. New washer, dryer, refrigerator, garbage disposal, sink and faucet. The bedroom has a wall mounted 55" Samsung QLED smart tv. The home also has all new carpeting and flooring thru out with fresh painting. The home has a new Trane Runtru 95% efficient furnace and the garage has a new Trane Runtru furnace along with two new garage door openers, chains and springs. The garage also features a full bath, two storage rooms and a large attic. Outside you will find a new generator shed attached to the garage with a new Westinghouse generator inside that will power the whole house and a large utility shed in the back yard that has new shingles. Both the home and garage have a metal roof that was installed about 8 years ago.
Key facts
- New water softener
- New bladder
- 12 x 8 utility room
Tags
Property features AI
Finance
- HOA & community: Homeowners association present
Exterior
- Parking: Detached garage with approximately 2.5 car capacity; Paved driveway/road access
- Utilities: Private well water; Septic tank sewer
- Home design: Single-family residence; One level
- Construction: Aluminum siding; Block foundation; Built above grade with finished area of 1,244 (units recorded as square feet)
- Exterior features: Fenced yard; Shed(s)
Interior
- Kitchen: Oven; Range; Refrigerator
- Bedrooms: Total of 6 rooms (room-level details not specified)
- Bathrooms: 1 full bathroom
- Heating & cooling: Central air conditioning; Forced air heating; Natural gas heating
- Interior features: Fireplace in the living room; Crawl space/block basement
- Laundry & utility: Washer; Dryer; Gas water heater
Neighborhood map
What this means for you Summary
Snapshot
- This is a 2-bed/1.0-bath single-family listed at $140k.
Deal economics
- At list price, monthly cash flow is $-10 ($-118/yr) — negative.
- To cash-flow at today's rent, offer at most $138k (1.2% below list).
- To meet the 1% rule (rent ≥ 1% of price), the offer needs to be $102k (26.8% below list).
- Recommended offer: $102k (26.8% below list) — sets the bar for 1% rule.
Location & tenants
- Location reads: area grade D — affects rentability + tenant quality, not the cash-flow math above.
- Millington Community Schools (rural): math 23% / reading 37% proficiency, ranked #355 of 540 in MI (top 66%) — families likely to look elsewhere, expect single-tenant / working-renter base with shorter leases.
- Zoned schools: Meachum Elementary (math 17% / reading 27%, grade F, #1,035 of 1,397 statewide, top 77%, 472 students, 58% FRL); Millington Junior High School (math 17% / reading 42%, grade F, #343 of 493 statewide, top 72%, 222 students, 54% FRL); Millington High School (math 54% / reading 74%, grade B-, #46 of 713 statewide, top 7%, 384 students, 54% FRL).
- Market conditions: 154 active listings in the ZIP; 56 units permitted in Tuscola County in 2024 (0 in 5+ unit buildings).
Forward outlook
- Local home prices are declining (-3.0%/yr); year-one equity from $967 of loan paydown is wiped out by about $4k of value loss. Plan a longer hold.
- Tuscola County population projected at -29% by 2050 — secular population decline; favor cash flow + early exit over multi-decade hold.
Negotiation context
- Only 11 days on market — expect competitive offers; lowballing is unlikely to land.
- 8 sale attempts since 8y ago with the ask held roughly flat each time — persistent listings suggest the price (not the market) is what's stuck; bring a comps-based counter.
- Current owner paid $115k; 22% above their basis — modest negotiation headroom, anchor on the comps not their cost.
Questions for the listing agent
- What do current leases actually rent for vs. the listed asking? Can we see a recent rent roll and the last 12 months of T-12 income?
- Built in 1979 — when were the roof, HVAC, electrical panel, plumbing, and water heater last replaced?
- Is there a deadline driving the sale (1031 exchange, divorce, estate, relocation)? That informs how much negotiation room exists.
- The area grade is low — what's the realistic commute time and amenity access for the typical tenant pool here? Any planned neighborhood developments (good or bad) we should know about?
- What's the average days-on-market for RENTAL listings here right now (not sales)? A rising rental-DOM trend means longer vacancies and softer asking-rent achievability than the comps imply.
- What's the recent tenant-quality profile in this submarket — average credit score on applications, eviction rate, late-payment / NSF rate, and stable-employment percentage? A property-management company in the area should have these aggregated.
- How much new for-sale + rental construction is in the pipeline within 1–3 miles? Heavy new supply typically softens prices + rents 12–24 months out; constrained supply supports both.
Investment metrics
- 1% rule
- 0.73% ✗
- Cap rate
- 6.21%
- Cash-on-cash
- -0.30%
- DSCR
- 0.99
- GRM
- 11.4
CMA / ARV
- ARV (on-the-fly)
- $141,864
- Comps found
- 4
Show comp detail 4 sales within ~0.75 mi
| Address | Dist | Beds/Ba | Sqft | Sold | Price | $/sf | Match |
|---|---|---|---|---|---|---|---|
| 8642 Pine Ct | 0.14mi | 2/1.5 | 1,008 (-2%) | 7mo | $119,000 | $118 | 82 |
| 10304 Baker Dr | 0.11mi | 2/1.0 | 960 (-7%) | 4mo | $132,500 | $138 | 80 |
| 10365 Evelyn Dr | 0.19mi | 2/1.0 | 1,100 (+7%) | 18mo | $68,000 | $62 | 65 |
| 14482 N Bray Rd | 0.73mi | 3/1.0 (+1) | 1,122 (+9%) | 14mo | $180,000 | $160 | 34 |
Match score weights: distance 35% · size 25% · config 20% · recency 20%. Top-matched comps best support the ARV.
Projected returns pro-forma
-3.0% appreciation · 3.0% rent growth · sell at horizon
- IRR
- -16.9%
- Equity multiple
- 0.40×
- Total profit
- $-23,370
- Equity at exit
- $20,860
- IRR
- -8.8%
- Equity multiple
- 0.45×
- Total profit
- $-21,463
- Equity at exit
- $12,096
Cash invested: $39,172 (down + closing). Projections, not guarantees.
Landlord ↔ Tenant lean methodology
- Overall (STATE)
- 62 Landlord-Friendly
- State Michigan
- 62 Landlord-Friendly · EVEN
- County
- — inherits STATE
- City
- — inherits STATE
ZIP-level market 48420
- Active inventory
- 154
- Price-to-rent
- 11.4×
Monthly cashflow live
- Estimated rent
- $1,023 medium interval (Pro) →
- Mortgage (P&I)
- −$734
- Tax from tax record
- −$26 /mo · $316/yr
- Insurance
- −$58
- HOA
- −$0
- Vacancy / Maint / Mgmt
- −$215
- Net cashflow
- $-10
Break-even live
Sensitivity live
| Price | -10% $69 | -5% $30 | +0% $-10 | +5% $-49 | +10% $-89 |
|---|---|---|---|---|---|
| Rent | -10% $-91 | -5% $-50 | +0% $-10 | +5% $31 | +10% $71 |
| Rate | -1.0pp $61 | -0.5pp $26 | base $-10 | +0.5pp $-46 | +1.0pp $-83 |
UW: 25.0% down · 7.5% · 30yr · 1.5% tax · 5.0% vac · 8.0% maint · 8.0% mgmt
Financing live
Cash to close
- Down payment
- $34,975
- Closing costs
- $4,197
- Reserves months
- —
- Total cash needed
- —
Loan-product check · same deal, 3 products live
Conventional
25% down · 7.5% · 30yr
- Down + closing
- —
- Monthly P&I
- —
- Monthly cashflow
- —
- DSCR
- —
- Eligible?
- —
Personal DTI + credit; lowest rate.
DSCR
20% down · 8.5% · 30yr
- Down + closing
- —
- Monthly P&I
- —
- Monthly cashflow
- —
- DSCR
- —
- Eligible?
- —
No personal income docs; deal must DSCR.
Hard money
10% down · 12.0% · 12mo
- Down + closing
- —
- Monthly P&I
- —
- Monthly cashflow
- —
- DSCR
- —
- Eligible?
- —
Short-term bridge; refi at stabilization.
Listing history 10 events
-
2026-06-22days on market $139,900 Active 11 DOM
-
2026-06-21days on market $139,900 Active 10 DOM
-
2026-06-21days on market $139,900 Active 9 DOM
-
2026-06-18days on market $139,900 Active 7 DOM
-
2026-06-17days on market $139,900 Active 6 DOM
-
2026-06-16days on market $139,900 Active 5 DOM
-
2026-06-15days on market $139,900 Active 4 DOM
-
2026-06-13days on market $139,900 Active 2 DOM
-
2026-06-12remarks 694-char remark
-
2026-06-12$139,900 Active 1 DOM
ⓘ Source: listings_history table (triggers on properties + properties_extension) + one-shot
backfill from property_details.listing_events for pre-trigger history.
Tax reassessment forecast MI · Partial reset (capped growth)
- Current annual tax
- $316 · $26/mo
- Projected year-2 tax
- $1,235 · $103/mo
- Expected delta
- +$919/yr (+$77/mo · 290.6%)
ⓘ Screening estimate from a state-policy table — verify with the county assessor before closing.
Climate risk First Street
- Flood 1/10 Low FEMA zone X (unshaded) · 0% chance over 30 yrs
- Wildfire 3/10 Moderate
- Heat 2/10 Low 7 d/yr ≥97°F today · 14 d/yr by 30 yrs out
- Wind 1/10 Low
- Air quality 2/10 Low 1 unhealthy d/yr today · 3 by 30 yrs out
Nearby sold comps map
Loading sold comps map…
Walkable amenities ~0.75 mi
Loading nearby amenities…
Taxation est. · year 1
- Rental income
- $12,281
- − Mortgage interest
- −$7,837
- − Property taxes
- −$316
- − Insurance
- −$700
- − Repairs & maintenance
- −$982
- − Management
- −$982
- − Depreciation
- −$4,070
- Taxable loss
- −$2,606
- Est. tax savings @ 24.0%
- +$626
- After-tax cash flow
- $508/yr
For passive investors: Depreciation is non-cash, so a rental often shows a tax loss while cash-flowing — sheltering income. Rental losses are passive: they offset passive income freely, and up to $25,000/yr can offset ordinary (W-2) income if you actively participate and your MAGI is under $100k (phasing out to $0 by $150k); unused losses carry forward. On sale, claimed depreciation is recaptured at up to 25%, and gains may owe capital-gains tax (a 1031 exchange can defer both). Figures are a year-1 estimate at your 24.0% rate — not tax advice; consult a CPA.
Schools (NCES district)
- District
- Millington Community Schools
- NCES district ID
- 2623910
- Math proficiency
- 23% ▼ -7.00%
- Reading proficiency
- 37% ▼ -12.00%
- Median HH income
- $48,943
- Composite
- 26.05/100
- National rank
- #7301
- State rank
- #355 of 540 in MI
Livability — Arbela
No livability data for this city. (Only ~50 U.S. cities are tracked.)
Census & demographics
- Population (ZIP)
- 21,213
Population outlook (Tuscola County) Hauer SSP2
- Today (2025)
- 49,930 people
- By 2030
- 47,294 · -5.3%
- By 2040
- 41,504 · -16.9%
- By 2050
- 35,560 · -28.8%
- By 2075
- 24,455 · -51.0%
- By 2100
- 16,507 · -66.9%
Race, ethnicity, and origin ACS 2023
- Neighborhood character
- Predominantly White (89%)
- Race & ethnicity
- White 89% Hispanic / Latino 4% Two or more races 3% Black 3%
- Common ancestry
- Romanian 8% Lithuanian 5% Italian 4%
- Foreign-born
- 2% · Canada
- Languages at home
- 96% English-only · Spanish 2% Other Indo-European 1%
Political lean MEDSL · Tuscola
- 2024 margin
- Solid R (+43.0) · D 27.9% · R 70.9% · Other 1.3%
- 2008→2024 swing
- -42.1pp toward R · 2008: -0.8pp · 2024: -43.0pp
- All cycles
- 2024: R+43.0 2020: R+39.3 2016: R+38.0 2012: R+10.8 2008: R+0.8
Not yet ingested
- Civics
- —
Market trends
- HPI YoY
- ▼ -192.27%
- Current HPI
- 186.7816
- Rent YoY
- —
- Metro
- —
- State GDP YoY
- ▲ 1.37%
- F500 in state
- 28
Industry mix (Fortune 500 HQ in MI)
| Industry | F500 HQs | Revenue |
|---|---|---|
| Automotive Parts | 3 | $48B |
|
||
| Automotive | 2 | $372B |
|
||
| Chemicals | 1 | $45B |
|
||
| Automotive Retail | 1 | $29B |
|
||
| Healthcare / Medical Devices | 1 | $23B |
|
||
| Automotive Technology | 1 | $20B |
|
||
Price history
+210.9% since first listed27 events — show timeline
- 2026-06-11 Listed $139,900 REALCOMP
- 2026-06-11 Listed $139,900 MiRealSource-MiMLS
- 2023-06-20 Sold (Public Records) $115,000 Public Records
- 2023-06-12 Sold (MLS) $115,000 MiRealSource-MiMLS
- 2023-06-12 Sold (MLS) $115,000 REALCOMP
- 2023-06-07 Pending — MiRealSource-MiMLS
- 2023-06-07 Pending — REALCOMP
- 2023-05-22 Price Changed $115,000 MiRealSource-MiMLS
- 2023-05-22 Price Changed $115,000 REALCOMP
- 2023-04-14 Listed $120,000 MiRealSource-MiMLS
- 2023-04-14 Listed $120,000 REALCOMP
- 2023-04-11 Coming Soon $120,000 MiRealSource-MiMLS
- 2023-04-11 Coming Soon $120,000 REALCOMP
- 2021-01-07 Sold (Public Records) $62,500 Public Records
- 2021-01-04 Sold (MLS) $62,500 REALCOMP
- 2020-12-30 Pending — REALCOMP
- 2020-12-28 Listing Removed — MiRealSource-MiMLS
- 2020-12-19 Contingent — REALCOMP
- 2020-12-16 Listed $65,000 MiRealSource-MiMLS
- 2020-12-16 Listed $65,000 REALCOMP
- 2018-10-15 Sold (Public Records) $45,000 Public Records
- 2018-09-26 Sold (MLS) $45,000 MiRealSource-MiMLS
- 2018-09-26 Sold (MLS) $45,000 REALCOMP
- 2018-08-17 Pending — MiRealSource-MiMLS
- 2018-08-17 Pending — REALCOMP
- 2018-07-09 Listed $45,000 MiRealSource-MiMLS
- 2018-07-09 Listed $45,000 REALCOMP
Property tax history
-4.0%/yrLatest (2025): $316 · -73.8% YoY. Source: county tax records.
Cash-flow waterfall
monthlySold comps — $/sqft
last 12 mo · ≤1 miLoading sold comps…