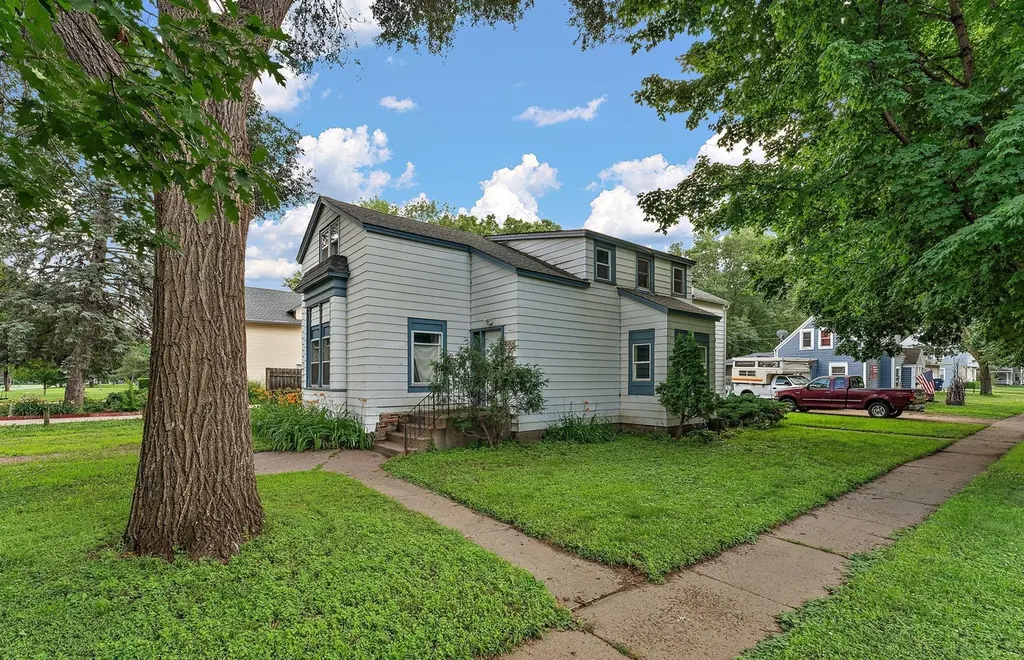
600 Oak St
Farmington, MN 55024
$400,000B
7 bd · 4.0 ba ·
4,306 sqft ·
Built 1900
· MultiFamily
· Active
· 29 DOM
Cashflow @ list (25.0% down · 7.5%)
Estimated rent
$7,368/mo
Mortgage (P&I)
−$2,098
Tax + insurance
−$963
HOA
−$0
Vac / Maint / Mgmt
−$1,547
Net cashflow
$2,760/mo
Annual
$33,123/yr
Cap rate
14.57%
Cash-on-cash
29.57%
DSCR
2.32
1% rule
1.84%
Cash to close
$112,000
Investor read
- This is a 7-bed/4.0-bath multifamily listed at $400k.
- At list price, monthly cash flow is $3k ($33k/yr) — positive.
- The deal already cash-flows at list — no discount required.
- Meets the 1% rule at list price ($7k rent vs $400k).
- It's been on market 29 days — a 2% lower offer ($394k) is reasonable based on typical stale-listing flexibility.
- Recommended offer: $394k (1.5% below list) — sets the bar for market timing.
- Local home prices are declining (-3.0%/yr); year-one equity from $3k of loan paydown is wiped out by about $12k of value loss. Plan a longer hold.
- Location reads 75/100 on livability (#203 in MN, #4,269 nationally) — a middle-class / working-renter tenant base. Strengths: crime A+, employment A+, housing A+; Watch: amenities F, commute F.
- Farmington Public School District (suburban): math 43% / reading 52% proficiency, ranked #104 of 301 in MN (top 35%) — families likely to look elsewhere, expect single-tenant / working-renter base with shorter leases; only 12% free/reduced lunch — higher-income household profile.
- Watch-outs: built in 1900 — expect roof / HVAC / electrical / plumbing capex.
- Market conditions: 325 active listings in the ZIP; high-income renter base; 2,134 units permitted in Dakota County in 2024 (898 in 5+ unit buildings).
- Dakota County population projected at +11% by 2050 — modest demand growth; plan on rents tracking national, not racing it.
- 3 sale attempts; this cycle's ask has dropped $50k (11%) from the opening price — seller is motivated, your offer sets the floor, not the list.
- At projected returns (-3.0% appreciation + 3.0% rent growth), your $112k cash investment doubles in ~5 years — after that, you're playing with house money.
- Cap rate 14.6% vs local median 3.8% in Farmington — top-decile yield for the area; either an underpriced asset or a hidden risk that comps aren't pricing in. Stress-test before assuming the spread holds.
- At $7,368/mo this rent would consume 69% of the median local household income ($127k/yr) (locally 288% of renters already pay >50% of income on rent) — very limited rent-growth headroom before tenants either downsize or default.
Questions for listing agent
- Built in 1900 — when were the roof, HVAC, electrical panel, plumbing, and water heater last replaced?
- Is there a deadline driving the sale (1031 exchange, divorce, estate, relocation)? That informs how much negotiation room exists.
- Schools are B-rated — typically a magnet for longer-tenancy family renters. What's the average tenant stay here, and is there a school-zone premium baked into asking?
- What's the average days-on-market for RENTAL listings here right now (not sales)? A rising rental-DOM trend means longer vacancies and softer asking-rent achievability than the comps imply.
- What's the recent tenant-quality profile in this submarket — average credit score on applications, eviction rate, late-payment / NSF rate, and stable-employment percentage? A property-management company in the area should have these aggregated.
- How much new apartment / multifamily construction is in the pipeline within 1–3 miles? Heavy new supply (>2% of stock underway) typically softens rents 12–24 months out; light construction supports rent growth.
CashFlowRE · CFR-YYSYYY9TWN3RFS
· Data 2 days ago
cashflowre.app · 2026-05-29