 Multi-family
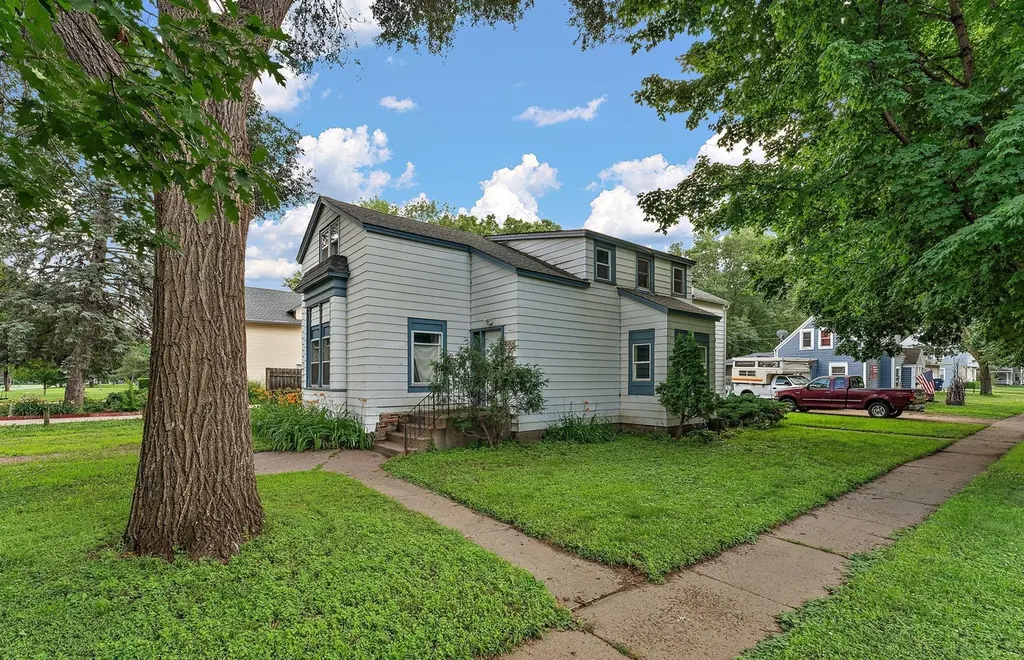
600 Oak St · Farmington, MN
Flood risk 1/10 · Minimal
- FEMA flood zone
- X (unshaded)
- Chance of flooding over 30 yrs
- 0.0%
- Est. flood insurance / yr
- $507 – $1,088
Fire risk 1/10 · Minimal
- Est. fire insurance / yr
- $888 – $1,650
Heat risk 2/10 · Minimal
- Hot days now (above 99°F)
- 7 days/yr
- Hot days in 30 yrs
- 14 days/yr
Wind risk 2/10 · Minimal
- Chance of severe wind over 30 yrs
- —
Air-quality risk 2/10 · Minimal
- Unhealthy air days now
- 1 days/yr
- Unhealthy air days in 30 yrs
- 2 days/yr
Risk factors via First Street. Map © Google.
Why this score? — see what drove the B grade
The composite is a weighted blend of 9 inputs, each scored 0–100. Each bar is that input's sub-score; the figure is the points it added to the 100-point composite (weight × sub-score).
- Cash flow +30.0/30.0
- 1% rule +10.0/10.0
- DSCR +10.0/10.0
- ARV discount +7.5/15.0
- Schools +4.4/10.0
- Livability +3.8/5.0
- Rent growth +2.5/5.0
- Condition / age +2.5/5.0
- Appreciation +0.0/10.0
$400,000
🖨 Deal sheet 📄 Offer letter ✓ Due diligence
Multi-family units
County records classify this as Multi-Family (5+ Unit). Listing-text estimate: 1 unit. estimate disagrees with records
5+ unit building — per-unit beds/baths from public records are typically unavailable; the breakdown below (if shown) is an estimate from the listing text.
Listing remarks MLS
Discover a rare and versatile property in the heart of Farmington featuring an updated triplex plus a separate single-family home, all on one spacious parcel. Whether you're a seasoned investor or looking to live in one unit while generating rental income from the others, this property offers exceptional potential. The triplex includes one 1-bedroom, 1-bath unit and two 2-bedroom, 1-bath units. Each thoughtfully updated within the last five years to reflect modern finishes and comfort. In addition, the standalone 2-bedroom, 1-bath single-family home provides a private living space perfect for an owner-occupant, on-site manager, or additional tenant. Each unit has its own charm, with updated kitchens, baths, flooring, and fixtures. The property also offers off-street parking and is conveniently located near downtown amenities, schools, and public transportation
Key facts
- Updated baths
- Updated triplex
- Updated flooring
Tags
Neighborhood map
What this means for you Summary
Snapshot
- This is a 7-bed/4.0-bath multifamily listed at $400k.
Deal economics
- At list price, monthly cash flow is $3k ($33k/yr) — positive.
- The deal already cash-flows at list — no discount required.
- Meets the 1% rule at list price ($7k rent vs $400k).
- Recommended offer: $394k (1.5% below list) — sets the bar for market timing.
- Cap rate 14.6% vs local median 3.8% in Farmington — top-decile yield for the area; either an underpriced asset or a hidden risk that comps aren't pricing in. Stress-test before assuming the spread holds.
Location & tenants
- Location reads 75/100 on livability (#203 in MN, #4,269 nationally) — a middle-class / working-renter tenant base. Strengths: crime A+, employment A+, housing A+; Watch: amenities F, commute F.
- Farmington Public School District (suburban): math 43% / reading 52% proficiency, ranked #104 of 301 in MN (top 35%) — families likely to look elsewhere, expect single-tenant / working-renter base with shorter leases; only 12% free/reduced lunch — higher-income household profile.
- Market conditions: 325 active listings in the ZIP; high-income renter base; 2,134 units permitted in Dakota County in 2024 (898 in 5+ unit buildings).
- At $7,368/mo this rent would consume 69% of the median local household income ($127k/yr) (locally 288% of renters already pay >50% of income on rent) — very limited rent-growth headroom before tenants either downsize or default.
Forward outlook
- Local home prices are declining (-3.0%/yr); year-one equity from $3k of loan paydown is wiped out by about $12k of value loss. Plan a longer hold.
- Dakota County population projected at +11% by 2050 — modest demand growth; plan on rents tracking national, not racing it.
- At projected returns (-3.0% appreciation + 3.0% rent growth), your $112k cash investment doubles in ~5 years — after that, you're playing with house money.
Negotiation context
- It's been on market 29 days — a 2% lower offer ($394k) is reasonable based on typical stale-listing flexibility.
- 3 sale attempts; this cycle's ask has dropped $50k (11%) from the opening price — seller is motivated, your offer sets the floor, not the list.
Risks & watch-outs
- Watch-outs: built in 1900 — expect roof / HVAC / electrical / plumbing capex.
Questions for the listing agent
- Built in 1900 — when were the roof, HVAC, electrical panel, plumbing, and water heater last replaced?
- Is there a deadline driving the sale (1031 exchange, divorce, estate, relocation)? That informs how much negotiation room exists.
- Schools are B-rated — typically a magnet for longer-tenancy family renters. What's the average tenant stay here, and is there a school-zone premium baked into asking?
- What's the average days-on-market for RENTAL listings here right now (not sales)? A rising rental-DOM trend means longer vacancies and softer asking-rent achievability than the comps imply.
- What's the recent tenant-quality profile in this submarket — average credit score on applications, eviction rate, late-payment / NSF rate, and stable-employment percentage? A property-management company in the area should have these aggregated.
- How much new apartment / multifamily construction is in the pipeline within 1–3 miles? Heavy new supply (>2% of stock underway) typically softens rents 12–24 months out; light construction supports rent growth.
Investment metrics
- 1% rule
- 1.84% ✓
- Cap rate
- 14.57%
- Cash-on-cash
- 29.57%
- DSCR
- 2.32
- GRM
- 4.5
CMA / ARV
No comps found within radius.
Projected returns pro-forma
-3.0% appreciation · 3.0% rent growth · sell at horizon
- IRR
- 24.1%
- Equity multiple
- 1.99×
- Total profit
- $111,277
- Equity at exit
- $59,641
- IRR
- 32.0%
- Equity multiple
- 3.90×
- Total profit
- $324,462
- Equity at exit
- $34,585
Cash invested: $112,000 (down + closing). Projections, not guarantees.
Landlord ↔ Tenant lean methodology
- Overall (STATE)
- 46 Balanced
- State Minnesota
- 46 Balanced · D+2
- County
- — inherits STATE
- City
- — inherits STATE
ZIP-level market 55024
- Home prices YoY
- -31.2%
- Active inventory
- 325
- Price-to-rent
- 21.8×
Monthly cashflow live
- Estimated rent
- $7,368 medium interval (Pro) →
- Mortgage (P&I)
- −$2,098
- Tax from tax record
- −$796 /mo · $9,554/yr
- Insurance
- −$167
- HOA
- −$0
- Vacancy / Maint / Mgmt
- −$1,547
- Net cashflow
- $2,760
Break-even live
4-unit breakdown (identical units grouped — click to expand)
| Units | Beds | Baths | Est. rent |
|---|---|---|---|
| 1× unit | 1 | 1 | $1,529 |
| 3× units | 2 | 1 | $5,838 |
| #2 | 2 | 1 | $1,946 |
| #3 | 2 | 1 | $1,946 |
| #4 | 2 | 1 | $1,946 |
| Total (4 units) | $7,368 | ||
UW: 25.0% down · 7.5% · 30yr · 1.5% tax · 5.0% vac · 8.0% maint · 8.0% mgmt
Financing live
Cash to close
- Down payment
- $100,000
- Closing costs
- $12,000
- Reserves months
- —
- Total cash needed
- —
Loan-product check · same deal, 3 products live
Conventional
25% down · 7.5% · 30yr
- Down + closing
- —
- Monthly P&I
- —
- Monthly cashflow
- —
- DSCR
- —
- Eligible?
- —
Personal DTI + credit; lowest rate.
DSCR
20% down · 8.5% · 30yr
- Down + closing
- —
- Monthly P&I
- —
- Monthly cashflow
- —
- DSCR
- —
- Eligible?
- —
No personal income docs; deal must DSCR.
Hard money
10% down · 12.0% · 12mo
- Down + closing
- —
- Monthly P&I
- —
- Monthly cashflow
- —
- DSCR
- —
- Eligible?
- —
Short-term bridge; refi at stabilization.
Listing history 24 events
-
2026-06-18days on market $400,000 Active 29 DOM
-
2026-06-17days on market $400,000 Active 28 DOM
-
2026-06-16days on market $400,000 Active 27 DOM
-
2026-06-15days on market $400,000 Active 26 DOM
-
2026-06-13days on market $400,000 Active 24 DOM
-
2026-06-09days on market $400,000 Active 20 DOM
-
2026-06-08days on market $400,000 Active 19 DOM
-
2026-06-07days on market $400,000 Active 18 DOM
-
2026-06-04days on market $400,000 Active 15 DOM
-
2026-06-03days on market $400,000 Active 14 DOM
-
2026-06-02days on market $400,000 Active 13 DOM
-
2026-06-02price $400,000 Active 12 DOM
-
2026-06-01days on market $420,000 Active 12 DOM
-
2026-05-31days on market $420,000 Active 11 DOM
-
2026-03-13historical
-
2026-03-12$450,000 Active 872-char remark
Show marketing remark (872 chars)
Discover a rare and versatile property in the heart of Farmington featuring an updated triplex plus a separate single-family home, all on one spacious parcel. Whether you're a seasoned investor or looking to live in one unit while generating rental income from the others, this property offers exceptional potential. The triplex includes one 1-bedroom, 1-bath unit and two 2-bedroom, 1-bath units. Each thoughtfully updated within the last five years to reflect modern finishes and comfort. In addition, the standalone 2-bedroom, 1-bath single-family home provides a private living space perfect for an owner-occupant, on-site manager, or additional tenant. Each unit has its own charm, with updated kitchens, baths, flooring, and fixtures. The property also offers off-street parking and is conveniently located near downtown amenities, schools, and public transportation
-
2026-03-03price $499,000
-
2025-11-06historical
-
2025-11-05$550,000 Active
-
2025-10-16price $595,000
-
2025-10-01price $615,000
-
2025-09-02price $625,000
-
2025-07-26price $650,000
-
2025-07-26$699,000 Active
ⓘ Source: listings_history table (triggers on properties + properties_extension) + one-shot
backfill from property_details.listing_events for pre-trigger history.
Tax reassessment forecast MN · Partial reset (capped growth)
- Current annual tax
- $9,554 · $796/mo
- Projected year-2 tax
- $9,554 · $796/mo
- Expected delta
- $0/yr ($0/mo · 0.0%)
ⓘ Screening estimate from a state-policy table — verify with the county assessor before closing.
Climate risk First Street
- Flood 1/10 Low FEMA zone X (unshaded) · 0% chance over 30 yrs
- Wildfire 1/10 Low
- Heat 2/10 Low 7 d/yr ≥99°F today · 14 d/yr by 30 yrs out
- Wind 2/10 Low
- Air quality 2/10 Low 1 unhealthy d/yr today · 2 by 30 yrs out
Nearby sold comps map
Loading sold comps map…
Walkable amenities ~0.75 mi
Loading nearby amenities…
Taxation est. · year 1
- Rental income
- $88,416
- − Mortgage interest
- −$22,406
- − Property taxes
- −$9,554
- − Insurance
- −$2,000
- − Repairs & maintenance
- −$7,073
- − Management
- −$7,073
- − Depreciation
- −$11,636
- Taxable income
- $28,673
- Est. tax owed @ 24.0%
- −$6,881
- After-tax cash flow
- $26,241/yr
For passive investors: Depreciation is non-cash, so a rental often shows a tax loss while cash-flowing — sheltering income. Rental losses are passive: they offset passive income freely, and up to $25,000/yr can offset ordinary (W-2) income if you actively participate and your MAGI is under $100k (phasing out to $0 by $150k); unused losses carry forward. On sale, claimed depreciation is recaptured at up to 25%, and gains may owe capital-gains tax (a 1031 exchange can defer both). Figures are a year-1 estimate at your 24.0% rate — not tax advice; consult a CPA.
Schools (NCES district)
- District
- Farmington Public School District
- NCES district ID
- 2711820
- Math proficiency
- 43% ▼ -12.00%
- Reading proficiency
- 52% ▼ -7.00%
- Median HH income
- $83,959
- Composite
- 43.93/100
- National rank
- #2905
- State rank
- #104 of 301 in MN
Livability — Farmington
- Score
- 75/100
- State rank
- #203
- US rank
- #4269
Category grades
Schools grade is shown separately in the Schools card above.
Census & demographics
- Census place
- Farmington, MN
- County
- Dakota County · 417,704 people
- City population
- 37,287
- Metro
- Minneapolis-St. Paul-Bloomington, MN-WI
- Population (ZIP)
- 37,287
- Household income
- $127,280
- Rent vs Own
- Severe rent burden
- 288.0
Population outlook (Dakota County) Hauer SSP2
- Today (2025)
- 450,671 people
- By 2030
- 465,068 · +3.2%
- By 2040
- 486,770 · +8.0%
- By 2050
- 498,743 · +10.7%
- By 2075
- 533,865 · +18.5%
- By 2100
- 550,133 · +22.1%
Race, ethnicity, and origin ACS 2023
- Neighborhood character
- Predominantly White (84%)
- Race & ethnicity
- White 84% Hispanic / Latino 6% Two or more races 4% Black 4% Asian 3%
- Hispanic origin (detail)
- Mexican 3%
- Common ancestry
- Portuguese 14% Scottish 3% Romanian 3%
- Foreign-born
- 5% · Canada, Vietnam
- Languages at home
- 93% English-only · Spanish 3% Other Asian/Pacific 1% Russian/Polish/Slavic 1%
Political lean MEDSL · Dakota
- 2024 margin
- D (+12.9) · D 55.4% · R 42.5% · Other 2.1%
- 2008→2024 swing
- +7.4pp toward D · 2008: 5.5pp · 2024: 12.9pp
- All cycles
- 2024: D+12.9 2020: D+13.9 2016: D+4.7 2012: D+2.9 2008: D+5.5
Not yet ingested
- Civics
- —
Market trends
- HPI YoY
- ▼ -102.47%
- Current HPI
- 225.6882
- Rent YoY
- —
- Metro
- Minneapolis-St. Paul-Bloomington, MN-WI
- State GDP YoY
- ▲ 2.41%
- F500 in state
- 34
Industry mix (Fortune 500 HQ in MN)
| Industry | F500 HQs | Revenue |
|---|---|---|
| Healthcare | 2 | $407B |
|
||
| Retail | 2 | $150B |
|
||
| Consumer Goods | 2 | $32B |
|
||
| Industrial Machinery | 2 | $6B |
|
||
| Agriculture | 1 | $40B |
|
||
| Healthcare / Medical Devices | 1 | $32B |
|
||
Price history
-35.6% since first listed10 events — show timeline
- 2026-03-13 Listing Removed — NORTHSTARMLS as Distributed by MLS Grid
- 2026-03-12 Listed $450,000 NORTHSTARMLS as Distributed by MLS Grid
- 2026-03-03 Price Changed $499,000 NORTHSTARMLS as Distributed by MLS Grid
- 2025-11-06 Listing Removed — NORTHSTARMLS as Distributed by MLS Grid
- 2025-11-05 Listed $550,000 NORTHSTARMLS as Distributed by MLS Grid
- 2025-10-16 Price Changed $595,000 NORTHSTARMLS as Distributed by MLS Grid
- 2025-10-01 Price Changed $615,000 NORTHSTARMLS as Distributed by MLS Grid
- 2025-09-02 Price Changed $625,000 NORTHSTARMLS as Distributed by MLS Grid
- 2025-07-26 Price Changed $650,000 NORTHSTARMLS as Distributed by MLS Grid
- 2025-07-26 Listed $699,000 NORTHSTARMLS as Distributed by MLS Grid
Property tax history
+6.5%/yrLatest (2025): $9,554 · +8.2% YoY. Source: county tax records.
Cash-flow waterfall
monthlySold comps — $/sqft
last 12 mo · ≤1 miLoading sold comps…