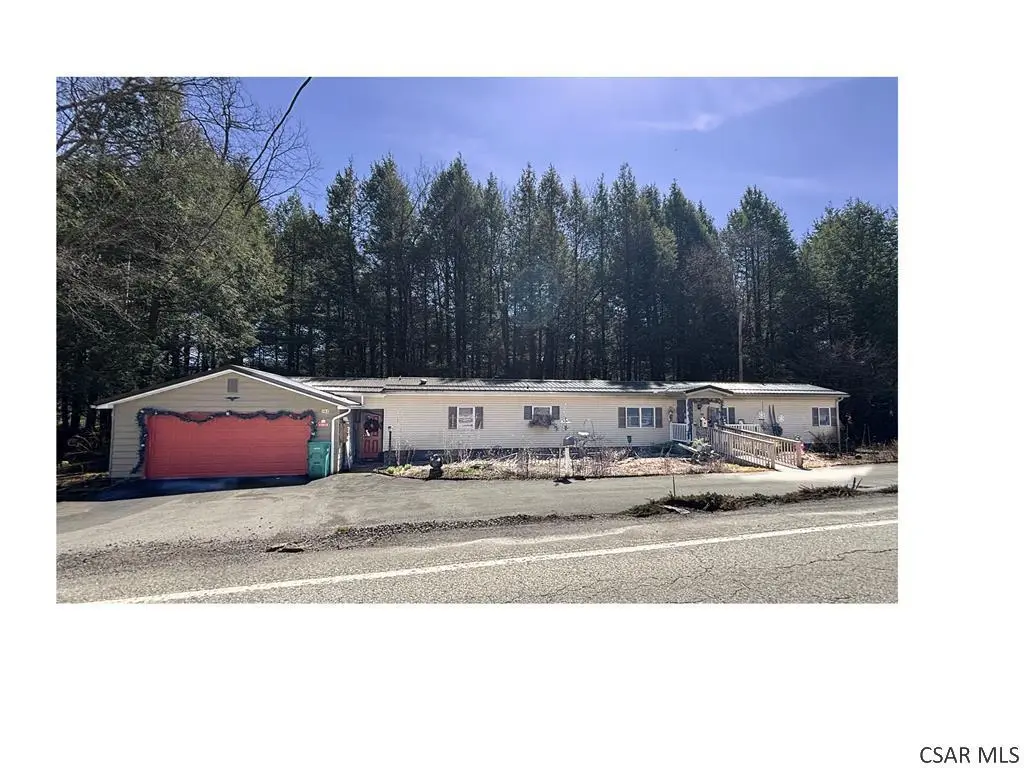
161 Rock Cut Rd
Shade, PA 15926
$89,500B
2 bd · 2.0 ba ·
1,304 sqft ·
Built 1967
· Manufactured
· Pending
· 59 DOM
Cashflow @ list (25.0% down · 7.5%)
Estimated rent
$1,148/mo
Mortgage (P&I)
−$469
Tax + insurance
−$559
HOA
−$0
Vac / Maint / Mgmt
−$241
Net cashflow
$-122/mo
Annual
$-1,460/yr
Cap rate
10.83%
Cash-on-cash
16.22%
DSCR
1.72
1% rule
1.28%
Cash to close
$25,060
Investor read
- This is a 2-bed/2.0-bath manufactured listed at $90k.
- At list price, monthly cash flow is $-122 ($-1k/yr) — negative.
- To cash-flow at today's rent, offer at most $68k (24.0% below list).
- Meets the 1% rule at list price ($1k rent vs $90k).
- It's been on market 59 days — a 3% lower offer ($87k) is reasonable based on typical stale-listing flexibility.
- Recommended offer: $68k (24.0% below list) — sets the bar for cash-flow.
- In year one you build about $4k of equity ($619 loan paydown + $3k appreciation (3.9% local appreciation)).
- Location reads: area grade B — affects rentability + tenant quality, not the cash-flow math above.
- Shade-Central City SD (rural): math 45% / reading 55% proficiency, ranked #411 of 658 in PA (top 62%) — acceptable for families but not a draw, mixed tenant base, ~2y average lease.
- Zoned schools: Cairnbrook El Sch (math 32% / reading 47%, grade F, #947 of 1,518 statewide, top 65%, 166 students, 100% FRL); Shade Jshs (math 47% / reading 24%, grade F, #305 of 437 statewide, top 70%, 164 students, 60% FRL) — zoned schools average 80% FRL vs 42% district-wide (38 pts higher); higher-poverty schools than district average — tighter screening recommended.
- Zoned-school proficiency averages 38% at this address vs 50% district-wide (-12 pts) — the specific schools serving this property underperform the Shade-Central City SD average; the district grade overstates school quality for this exact location.
- Watch-outs: flood insurance adds $460/mo.
- Market conditions: 25 active listings in the ZIP; 78 units permitted in Somerset County in 2024 (0 in 5+ unit buildings).
- Somerset County population projected at -21% by 2050 — secular population decline; favor cash flow + early exit over multi-decade hold.
- 3 sale attempts since 18y ago with the ask held roughly flat each time — persistent listings suggest the price (not the market) is what's stuck; bring a comps-based counter.
- Current owner paid $28k; list at $90k implies a 220% gain — meaningful room to come down on a strong offer.
- By year 8, paydown + projected appreciation supports a ~$30k cash-out refi (75% LTV) — recoverable capital for the next deal without selling this one.
- Climate carrying-cost: in FEMA flood zone AE (mandatory federal flood insurance) — expect insurance premiums to compound above CPI over the hold.
Questions for listing agent
- What do current leases actually rent for vs. the listed asking? Can we see a recent rent roll and the last 12 months of T-12 income?
- It's been on market 59 days. Have you received any prior offers? Is the seller open to a 24% concession, seller financing, or rate buy-down credit?
- Built in 1967 — when were the roof, HVAC, electrical panel, plumbing, and water heater last replaced?
- What's the actual annual flood-insurance premium (NFIP or private), and is the property in a SFHA with mandatory coverage?
- Is there a deadline driving the sale (1031 exchange, divorce, estate, relocation)? That informs how much negotiation room exists.
- What's the average days-on-market for RENTAL listings here right now (not sales)? A rising rental-DOM trend means longer vacancies and softer asking-rent achievability than the comps imply.
- What's the recent tenant-quality profile in this submarket — average credit score on applications, eviction rate, late-payment / NSF rate, and stable-employment percentage? A property-management company in the area should have these aggregated.
- How much new for-sale + rental construction is in the pipeline within 1–3 miles? Heavy new supply typically softens prices + rents 12–24 months out; constrained supply supports both.
CashFlowRE · CFR-YZBK41DKC5WCVX
· Data 3 weeks ago
cashflowre.app · 2026-05-29