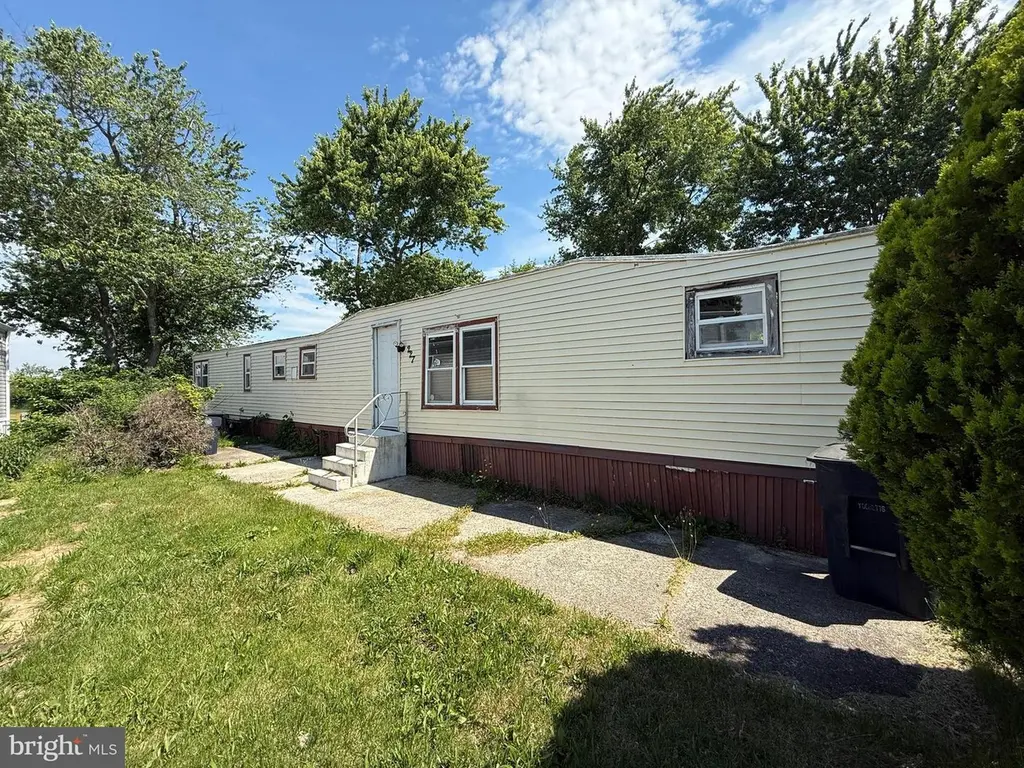
227 Nevada Ave
Sicklerville, NJ 08094
$38,000D
4 bd · 1.0 ba ·
1,000 sqft ·
Built 1972
· SingleFamily
· Active
· 10 DOM
Cashflow @ list (25.0% down · 7.5%)
Estimated rent
$3,019/mo
Mortgage (P&I)
−$199
Tax + insurance
−$63
HOA
−$0
Vac / Maint / Mgmt
−$634
Net cashflow
$2,123/mo
Annual
$25,473/yr
Cap rate
73.33%
Cash-on-cash
239.41%
DSCR
11.65
1% rule
7.95%
Cash to close
$10,640
Investor read
- This is a 4-bed/1.0-bath single-family listed at $38k.
- At list price, monthly cash flow is $2k ($25k/yr) — positive.
- The deal already cash-flows at list — no discount required.
- Meets the 1% rule at list price ($3k rent vs $38k).
- Only 10 days on market — expect competitive offers; lowballing is unlikely to land.
- Local home prices are declining (-3.0%/yr); year-one equity from $263 of loan paydown is wiped out by about $1k of value loss. Plan a longer hold.
- Location reads: area grade D — affects rentability + tenant quality, not the cash-flow math above.
- Monroe Township Public School District (suburban): math 20% / reading 45% proficiency, ranked #302 of 472 in NJ (top 64%) — families likely to look elsewhere, expect single-tenant / working-renter base with shorter leases.
- Market conditions: 268 active listings in the ZIP; 1 comparable units currently listed for rent nearby; solid renter incomes; 1,047 units permitted in Gloucester County in 2024 (183 in 5+ unit buildings).
- Gloucester County population projected to shrink 5% by 2050 — rents likely to lag national; underwrite the cash flow, not the appreciation.
- 3 sale attempts since 3y ago with the ask held roughly flat each time — persistent listings suggest the price (not the market) is what's stuck; bring a comps-based counter.
- Current owner paid $28k; 36% above their basis — modest negotiation headroom, anchor on the comps not their cost.
- At projected returns (-3.0% appreciation + 3.0% rent growth), your $11k cash investment doubles in ~1 year — after that, you're playing with house money.
- Cap rate 73.3% vs local median 4.7% in Sicklerville — top-decile yield for the area; either an underpriced asset or a hidden risk that comps aren't pricing in. Stress-test before assuming the spread holds.
- This rent runs 37% of the median local income ($97k/yr) — at the standard rent-burdened threshold; future hikes will face affordability resistance.
Questions for listing agent
- Built in 1972 — when were the roof, HVAC, electrical panel, plumbing, and water heater last replaced?
- Is there a deadline driving the sale (1031 exchange, divorce, estate, relocation)? That informs how much negotiation room exists.
- The area grade is low — what's the realistic commute time and amenity access for the typical tenant pool here? Any planned neighborhood developments (good or bad) we should know about?
- What's the average days-on-market for RENTAL listings here right now (not sales)? A rising rental-DOM trend means longer vacancies and softer asking-rent achievability than the comps imply.
- What's the recent tenant-quality profile in this submarket — average credit score on applications, eviction rate, late-payment / NSF rate, and stable-employment percentage? A property-management company in the area should have these aggregated.
- How much new for-sale + rental construction is in the pipeline within 1–3 miles? Heavy new supply typically softens prices + rents 12–24 months out; constrained supply supports both.
CashFlowRE · CFR-Z1A2PA50CX5CVC
· Data 1 day ago
cashflowre.app · 2026-05-29