227 Nevada Ave · Sicklerville, NJ
Flood risk No data
- FEMA flood zone
- —
- Chance of flooding over 30 yrs
- —
- Est. flood insurance / yr
- —
Fire risk No data
- Est. fire insurance / yr
- —
Heat risk No data
- Hot days now (above threshold)
- —
- Hot days in 30 yrs
- —
Wind risk No data
- Chance of severe wind over 30 yrs
- —
Air-quality risk No data
- Unhealthy air days now
- —
- Unhealthy air days in 30 yrs
- —
Risk factors via First Street. Map © Google.
Why this score? — see what drove the D grade
The composite is a weighted blend of 9 inputs, each scored 0–100. Each bar is that input's sub-score; the figure is the points it added to the 100-point composite (weight × sub-score).
- Cash flow +15.0/30.0
- ARV discount +7.5/15.0
- 1% rule +5.0/10.0
- DSCR +5.0/10.0
- Schools +3.0/10.0
- Rent growth +2.5/5.0
- Livability +2.5/5.0
- Condition / age +2.5/5.0
- Appreciation +0.0/10.0
$38,000
🖨 Deal sheet 📄 Offer letter ✓ Due diligence
Listing remarks MLS
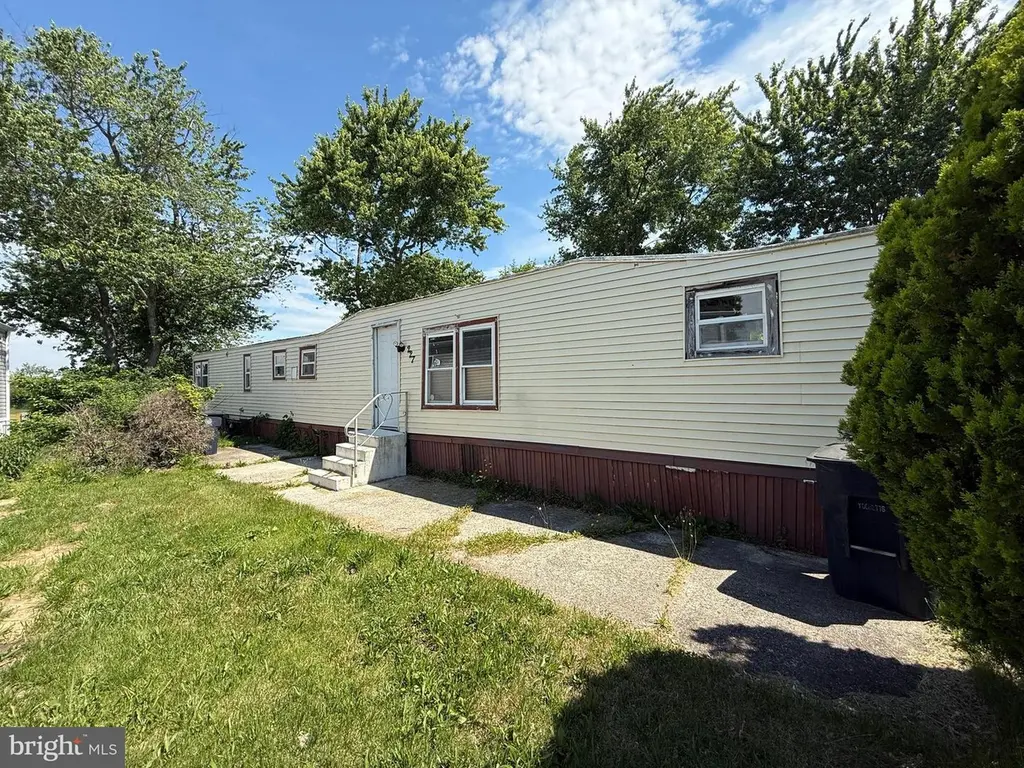
Welcome to Colonial Estates. This home features 4 bedrooms and 1 full bathroom, stainless steel appliances and laminate flooring. There are several animals in the house, including 4 dogs. The seller will crate the dogs and give access for showings.
Key facts
- 2 parking spots
- Built 1972
- Listed 9 days
Property features AI
Finance
- Other: Ownership interest is land lease
- Financial info: Lease not considered
- HOA & community: Land lease of $853 per month; Land lease years remaining: 127; Ground rent years remaining: 999 (annual ground rent noted)
Exterior
- Parking: Driveway parking (2 spaces); 2 total garage and parking spaces
- Utilities: Public water; Public sewer
- Home design: Single-wide mobile home; Mobile, pre-1976
- Construction: Modular/manufactured construction; Above-grade and below-grade other structures; Year built estimated
- Exterior features: Located in Colonial Estates park; Not in a federal flood zone; Ground rent exists (annual payment)
Interior
- Bedrooms: 4 bedrooms on the main level
- Bathrooms: 1 full bathroom (on the main level)
- Heating & cooling: Window air conditioning units; Natural gas hot water
- Interior features: Estimated living area; No basement; 7 total rooms
Neighborhood map
What this means for you Summary
Snapshot
- This is a 4-bed/1.0-bath single-family listed at $38k.
Deal economics
- At list price, monthly cash flow is $2k ($25k/yr) — positive.
- The deal already cash-flows at list — no discount required.
- Meets the 1% rule at list price ($3k rent vs $38k).
- Cap rate 73.3% vs local median 4.7% in Sicklerville — top-decile yield for the area; either an underpriced asset or a hidden risk that comps aren't pricing in. Stress-test before assuming the spread holds.
Location & tenants
- Location reads: area grade D — affects rentability + tenant quality, not the cash-flow math above.
- Monroe Township Public School District (suburban): math 20% / reading 45% proficiency, ranked #302 of 472 in NJ (top 64%) — families likely to look elsewhere, expect single-tenant / working-renter base with shorter leases.
- Market conditions: 268 active listings in the ZIP; 1 comparable units currently listed for rent nearby; solid renter incomes; 1,047 units permitted in Gloucester County in 2024 (183 in 5+ unit buildings).
- This rent runs 37% of the median local income ($97k/yr) — at the standard rent-burdened threshold; future hikes will face affordability resistance.
Forward outlook
- Local home prices are declining (-3.0%/yr); year-one equity from $263 of loan paydown is wiped out by about $1k of value loss. Plan a longer hold.
- Gloucester County population projected to shrink 5% by 2050 — rents likely to lag national; underwrite the cash flow, not the appreciation.
- At projected returns (-3.0% appreciation + 3.0% rent growth), your $11k cash investment doubles in ~1 year — after that, you're playing with house money.
Negotiation context
- Only 10 days on market — expect competitive offers; lowballing is unlikely to land.
- 3 sale attempts since 3y ago with the ask held roughly flat each time — persistent listings suggest the price (not the market) is what's stuck; bring a comps-based counter.
- Current owner paid $28k; 36% above their basis — modest negotiation headroom, anchor on the comps not their cost.
Questions for the listing agent
- Built in 1972 — when were the roof, HVAC, electrical panel, plumbing, and water heater last replaced?
- Is there a deadline driving the sale (1031 exchange, divorce, estate, relocation)? That informs how much negotiation room exists.
- The area grade is low — what's the realistic commute time and amenity access for the typical tenant pool here? Any planned neighborhood developments (good or bad) we should know about?
- What's the average days-on-market for RENTAL listings here right now (not sales)? A rising rental-DOM trend means longer vacancies and softer asking-rent achievability than the comps imply.
- What's the recent tenant-quality profile in this submarket — average credit score on applications, eviction rate, late-payment / NSF rate, and stable-employment percentage? A property-management company in the area should have these aggregated.
- How much new for-sale + rental construction is in the pipeline within 1–3 miles? Heavy new supply typically softens prices + rents 12–24 months out; constrained supply supports both.
Investment metrics
- 1% rule
- 7.95% ✓
- Cap rate
- 73.33%
- Cash-on-cash
- 239.41%
- DSCR
- 11.65
- GRM
- 1.0
CMA / ARV
- ARV (on-the-fly)
- $82,000
- Comps found
- 5
Show comp detail 5 sales within ~0.75 mi
| Address | Dist | Beds/Ba | Sqft | Sold | Price | $/sf | Match |
|---|---|---|---|---|---|---|---|
| 318 Arizona Ave | 0.10mi | 3/1.5 (-1) | 1,000 (0%) | 19mo | $70,000 | $70 | 73 |
| 301 Arizona Ave | 0.13mi | 3/1.0 (-1) | 900 (-10%) | 12mo | $73,352 | $82 | 62 |
| 306 Oklahoma Ave | 0.14mi | 3/2.0 (-1) | 1,100 (+10%) | 7mo | $78,500 | $71 | 62 |
| 109 Kennedy Ave | 0.25mi | 3/2.0 (-1) | 1,100 (+10%) | 11mo | $102,500 | $93 | 54 |
| 138 Hurffville Crosskeys Rd | 0.52mi | 4/1.0 | 1,140 (+14%) | 9mo | $279,000 | $245 | 45 |
Match score weights: distance 35% · size 25% · config 20% · recency 20%. Top-matched comps best support the ARV.
Projected returns pro-forma
-3.0% appreciation · 3.0% rent growth · sell at horizon
- IRR
- —
- Equity multiple
- 13.13×
- Total profit
- $129,085
- Equity at exit
- $5,666
- IRR
- —
- Equity multiple
- 27.94×
- Total profit
- $286,679
- Equity at exit
- $3,286
Cash invested: $10,640 (down + closing). Projections, not guarantees.
Landlord ↔ Tenant lean methodology
- Overall (STATE)
- 21 Tenant-Leaning
- State New Jersey
- 21 Tenant-Leaning · D+6
- County
- — inherits STATE
- City
- — inherits STATE
ZIP-level market 08094
- Active inventory
- 268
- Price-to-rent
- 1.0×
Monthly cashflow live
- Estimated rent
- $3,019 medium interval (Pro) →
- Mortgage (P&I)
- −$199
- Tax est. 1.5%
- −$48 /mo · $570/yr
- Insurance
- −$16
- HOA
- −$0
- Vacancy / Maint / Mgmt
- −$634
- Net cashflow
- $2,123
Break-even live
UW: 25.0% down · 7.5% · 30yr · 1.5% tax · 5.0% vac · 8.0% maint · 8.0% mgmt
Financing live
Cash to close
- Down payment
- $9,500
- Closing costs
- $1,140
- Reserves months
- —
- Total cash needed
- —
Loan-product check · same deal, 3 products live
Conventional
25% down · 7.5% · 30yr
- Down + closing
- —
- Monthly P&I
- —
- Monthly cashflow
- —
- DSCR
- —
- Eligible?
- —
Personal DTI + credit; lowest rate.
DSCR
20% down · 8.5% · 30yr
- Down + closing
- —
- Monthly P&I
- —
- Monthly cashflow
- —
- DSCR
- —
- Eligible?
- —
No personal income docs; deal must DSCR.
Hard money
10% down · 12.0% · 12mo
- Down + closing
- —
- Monthly P&I
- —
- Monthly cashflow
- —
- DSCR
- —
- Eligible?
- —
Short-term bridge; refi at stabilization.
Rent comps 1 comps
| Address | Beds | Baths | Sqft | Rent | $/sqft | DOM | Units | Dist |
|---|---|---|---|---|---|---|---|---|
| 343 Brookdale Blvd Williamstown, NJ | 3.0 | 2.5 | 1438 | $2,500 | $1.74 | 1d | 1 | 1.28mi |
Listing history 7 events
-
2026-06-18days on market $38,000 Active 10 DOM
-
2026-06-17days on market $38,000 Active 9 DOM
-
2026-06-16days on market $38,000 Active 8 DOM
-
2026-06-15days on market $38,000 Active 7 DOM
-
2026-06-13days on market $38,000 Active 5 DOM
-
2026-06-09remarks 358-char remark
-
2026-06-09$38,000 Active 1 DOM
ⓘ Source: listings_history table (triggers on properties + properties_extension) + one-shot
backfill from property_details.listing_events for pre-trigger history.
Nearby sold comps map
Loading sold comps map…
Walkable amenities ~0.75 mi
Loading nearby amenities…
Taxation est. · year 1
- Rental income
- $36,233
- − Mortgage interest
- −$2,129
- − Property taxes
- −$570
- − Insurance
- −$190
- − Repairs & maintenance
- −$2,899
- − Management
- −$2,899
- − Depreciation
- −$1,105
- Taxable income
- $26,442
- Est. tax owed @ 24.0%
- −$6,346
- After-tax cash flow
- $19,127/yr
For passive investors: Depreciation is non-cash, so a rental often shows a tax loss while cash-flowing — sheltering income. Rental losses are passive: they offset passive income freely, and up to $25,000/yr can offset ordinary (W-2) income if you actively participate and your MAGI is under $100k (phasing out to $0 by $150k); unused losses carry forward. On sale, claimed depreciation is recaptured at up to 25%, and gains may owe capital-gains tax (a 1031 exchange can defer both). Figures are a year-1 estimate at your 24.0% rate — not tax advice; consult a CPA.
Schools (NCES district)
- District
- Monroe Township Public School District
- NCES district ID
- 3410470
- Math proficiency
- 20% ▼ -24.00%
- Reading proficiency
- 45% ▼ -9.00%
- Median HH income
- $71,557
- Composite
- 30.24/100
- National rank
- #6295
- State rank
- #302 of 472 in NJ
Livability — Sicklerville
No livability data for this city. (Only ~50 U.S. cities are tracked.)
Census & demographics
- County
- Gloucester County · 160,422 people
- City population
- 50,264
- Metro
- Philadelphia-Camden-Wilmington, PA-NJ-DE-MD
- Population (ZIP)
- 41,595
- Household income
- $96,699
- Rent vs Own
- Severe rent burden
- 721.0
Population outlook (Gloucester County) Hauer SSP2
- Today (2025)
- 298,895 people
- By 2030
- 299,031 · +0.0%
- By 2040
- 294,020 · -1.6%
- By 2050
- 284,188 · -4.9%
- By 2075
- 260,720 · -12.8%
- By 2100
- 229,565 · -23.2%
Race, ethnicity, and origin ACS 2023
- Neighborhood character
- Predominantly White (73%)
- Race & ethnicity
- White 73% Hispanic / Latino 11% Black 10% Two or more races 8% Asian 1%
- Hispanic origin (detail)
- Puerto Rican 6% Dominican 1%
- Common ancestry
- Romanian 6% Slovak 2% Lithuanian 1%
- Foreign-born
- 4% · Canada
- Languages at home
- 92% English-only · Spanish 5% Russian/Polish/Slavic 1%
Political lean MEDSL · Gloucester
- 2024 margin
- Toss-up / Even · D 47.8% · R 50.6% · Other 1.6%
- 2008→2024 swing
- -15.0pp toward R · 2008: 12.2pp · 2024: -2.8pp
- All cycles
- 2024: R+2.8 2020: D+1.9 2016: R+0.4 2012: D+10.5 2008: D+12.2
Not yet ingested
- Civics
- —
Market trends
- HPI YoY
- ▼ -213.12%
- Current HPI
- 278.3849
- Rent YoY
- —
- Metro
- Philadelphia-Camden-Wilmington, PA-NJ-DE-MD
- State GDP YoY
- ▲ 2.05%
- F500 in state
- 34
Industry mix (Fortune 500 HQ in NJ)
| Industry | F500 HQs | Revenue |
|---|---|---|
| Consumer Goods | 3 | $31B |
|
||
| Pharmaceuticals | 2 | $153B |
|
||
| Technology | 2 | $21B |
|
||
| Insurance | 2 | $20B |
|
||
| Healthcare | 2 | $19B |
|
||
| Financial Services | 1 | $70B |
|
||
Price history
-36.7% since first listed9 events — show timeline
- 2026-06-08 Listed $38,000 BRIGHT MLS
- 2024-08-19 Sold (MLS) $28,000 BRIGHT MLS
- 2024-08-06 Pending — BRIGHT MLS
- 2024-06-20 Price Changed $34,999 BRIGHT MLS
- 2024-05-27 Listed $39,999 BRIGHT MLS
- 2024-05-23 Coming Soon $39,999 BRIGHT MLS
- 2023-12-19 Listing Removed — BRIGHT MLS
- 2023-10-20 Price Changed $50,000 BRIGHT MLS
- 2023-10-11 Listed $60,000 BRIGHT MLS
Cash-flow waterfall
monthlySold comps — $/sqft
last 12 mo · ≤1 miLoading sold comps…