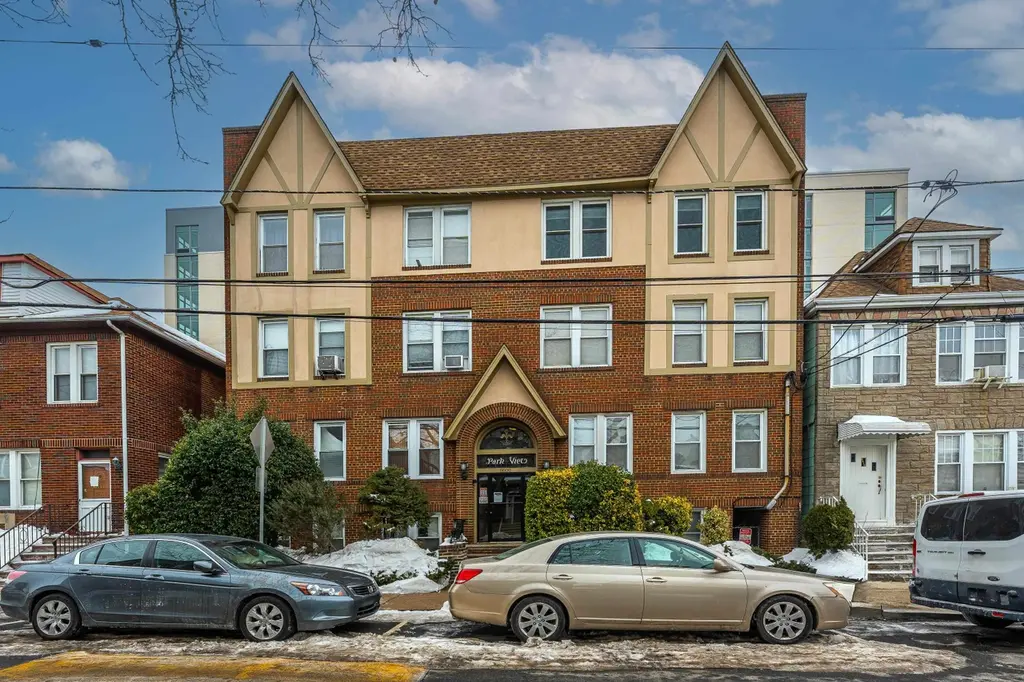
8600 1ST Ave Unit B3
Fairview, NJ 07047
$220,000D
1 bd · 1.0 ba ·
510 sqft ·
Built 1910
· Condo
· Under Contract
· 28 DOM
Cashflow @ list (25.0% down · 7.5%)
Estimated rent
$2,337/mo
Mortgage (P&I)
−$1,154
Tax + insurance
−$433
HOA
−$289
Vac / Maint / Mgmt
−$491
Net cashflow
$-29/mo
Annual
$-354/yr
Cap rate
6.13%
Cash-on-cash
-0.57%
DSCR
0.97
1% rule
1.06%
Cash to close
$61,600
Investor read
- This is a 1-bed/1.0-bath condo listed at $220k.
- At list price, monthly cash flow is $-29 ($-354/yr) — negative.
- To cash-flow at today's rent, offer at most $215k (2.4% below list).
- Meets the 1% rule at list price ($2k rent vs $220k).
- It's been on market 28 days — a 2% lower offer ($217k) is reasonable based on typical stale-listing flexibility.
- Recommended offer: $215k (2.4% below list) — sets the bar for cash-flow.
- Local home prices are declining (-3.0%/yr); year-one equity from $2k of loan paydown is wiped out by about $7k of value loss. Plan a longer hold.
- Location reads 74/100 on livability (#174 in NJ, #4,548 nationally) — a middle-class / working-renter tenant base. Strengths: crime A+, employment A+, housing A+; Watch: commute C-, schools D-, cost of living F.
- North Bergen School District (suburban): math 12% / reading 37% proficiency, ranked #393 of 472 in NJ (top 83%) — low school quality limits family demand, transient renter base, plan for 1-2y turnover.
- Watch-outs: built in 1910 — expect roof / HVAC / electrical / plumbing capex.
- Market conditions: Rents rising fast (+5.0%/yr); 209 active listings in the ZIP; 40 comparable units currently listed for rent nearby; rentals at typical pace (median 23d on market — plan ~3-4 weeks tenant-placement turnaround); solid renter incomes; 5,310 units permitted in Hudson County in 2024 (4,154 in 5+ unit buildings).
- Hudson County population projected at +29% by 2050 — long-run rental-demand tailwind backs the buy-and-hold thesis.
- 6 sale attempts since 21y ago with the ask held roughly flat each time — persistent listings suggest the price (not the market) is what's stuck; bring a comps-based counter.
- Current owner paid $150k; 47% above their basis — modest negotiation headroom, anchor on the comps not their cost.
- Cap rate 6.1% vs local median 2.5% in Fairview — top-decile yield for the area; either an underpriced asset or a hidden risk that comps aren't pricing in. Stress-test before assuming the spread holds.
- This rent runs 36% of the median local income ($79k/yr) — at the standard rent-burdened threshold; future hikes will face affordability resistance.
Questions for listing agent
- What do current leases actually rent for vs. the listed asking? Can we see a recent rent roll and the last 12 months of T-12 income?
- Built in 1910 — when were the roof, HVAC, electrical panel, plumbing, and water heater last replaced?
- What does the HOA fee cover, when was the last increase, and are there any pending special assessments or reserve-fund shortfalls?
- Any open or pending special assessments — roof, HVAC, plumbing, elevator, façade? What's the per-unit balance and payoff schedule, and is the seller paying it off at close or rolling it to the buyer?
- Is there a deadline driving the sale (1031 exchange, divorce, estate, relocation)? That informs how much negotiation room exists.
- Schools are D-rated, which usually means shorter tenancies and higher turnover. Who's the typical renter profile here, and what's been the actual vacancy rate?
- The area grade is low — what's the realistic commute time and amenity access for the typical tenant pool here? Any planned neighborhood developments (good or bad) we should know about?
- What's the average days-on-market for RENTAL listings here right now (not sales)? A rising rental-DOM trend means longer vacancies and softer asking-rent achievability than the comps imply.
CashFlowRE · CFR-Z2H3K8E2H92FKH
· Data 1 week ago
cashflowre.app · 2026-05-29