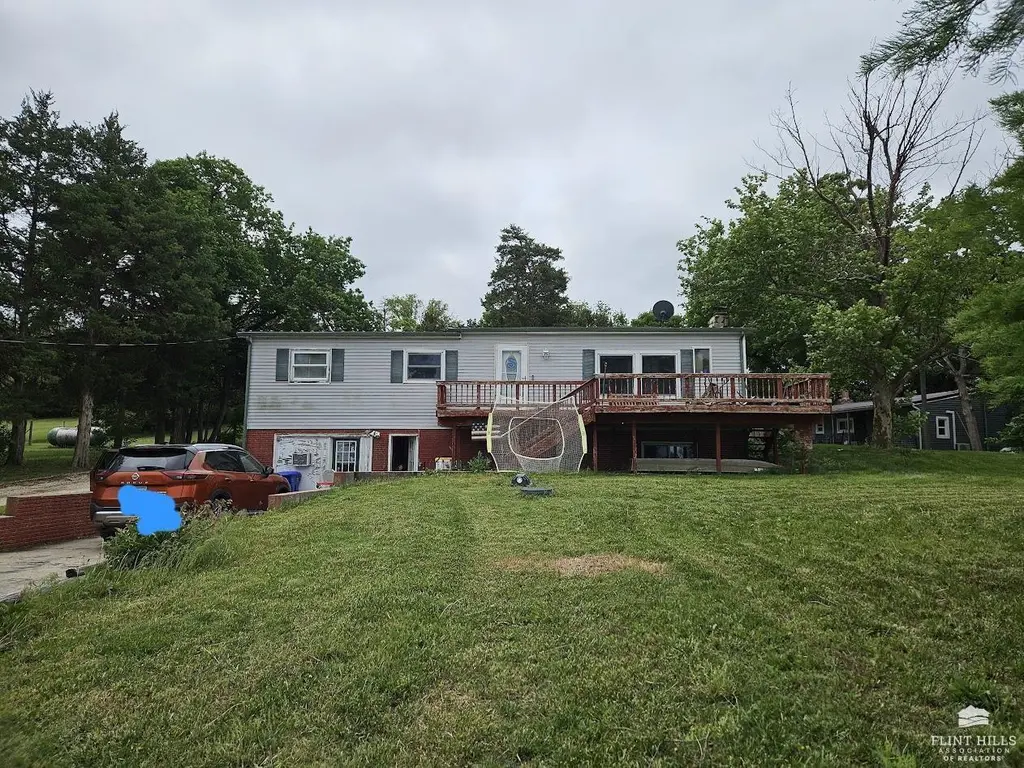
481 Sun Ln
Herington, KS 67449
$92,900D
3 bd · 2.5 ba ·
1,200 sqft ·
Built 1971
· Manufactured
· Active
· 11 DOM
Cashflow @ list (25.0% down · 7.5%)
Estimated rent
$869/mo
Mortgage (P&I)
−$487
Tax + insurance
−$225
HOA
−$0
Vac / Maint / Mgmt
−$182
Net cashflow
$-25/mo
Annual
$-303/yr
Cap rate
5.97%
Cash-on-cash
-1.17%
DSCR
0.95
1% rule
0.94%
Cash to close
$26,012
Investor read
- This is a 3-bed/2.5-bath manufactured listed at $93k.
- At list price, monthly cash flow is $-25 ($-303/yr) — negative.
- To cash-flow at today's rent, offer at most $88k (4.8% below list).
- To meet the 1% rule (rent ≥ 1% of price), the offer needs to be $87k (6.5% below list).
- Only 11 days on market — expect competitive offers; lowballing is unlikely to land.
- Recommended offer: $87k (6.5% below list) — sets the bar for 1% rule.
- In year one you build about $821 of equity ($642 loan paydown + $179 appreciation (0.2% local appreciation)).
- Location reads 70/100 on livability (#170 in KS) — a middle-class / working-renter tenant base. Strengths: cost of living A+, housing A+, health & safety A+; Watch: employment C-, amenities F, commute F.
- Herington (rural): math 28% / reading 33% proficiency, ranked #100 of 169 in KS (top 59%) — families likely to look elsewhere, expect single-tenant / working-renter base with shorter leases.
- Zoned schools: Herington Elem (math 42% / reading 42%, grade F, #273 of 684 statewide, top 45%, 187 students, 74% FRL); Herington Middle Sch (math 22% / reading 27%, grade F, #110 of 219 statewide, top 55%, 112 students, 74% FRL); Herington High (math 5% / reading 15%, grade F, #289 of 327 statewide, top 93%, 151 students, 60% FRL) — zoned schools average 70% FRL vs 49% district-wide (21 pts higher); higher-poverty schools than district average — tighter screening recommended.
- Market conditions: 29 active listings in the ZIP; 26 units permitted in Dickinson County in 2024 (0 in 5+ unit buildings).
- Dickinson County population projected at -12% by 2050 — secular population decline; favor cash flow + early exit over multi-decade hold.
Questions for listing agent
- What do current leases actually rent for vs. the listed asking? Can we see a recent rent roll and the last 12 months of T-12 income?
- Built in 1971 — when were the roof, HVAC, electrical panel, plumbing, and water heater last replaced?
- Is there a deadline driving the sale (1031 exchange, divorce, estate, relocation)? That informs how much negotiation room exists.
- Schools are F-rated, which usually means shorter tenancies and higher turnover. Who's the typical renter profile here, and what's been the actual vacancy rate?
- The area grade is low — what's the realistic commute time and amenity access for the typical tenant pool here? Any planned neighborhood developments (good or bad) we should know about?
- What's the average days-on-market for RENTAL listings here right now (not sales)? A rising rental-DOM trend means longer vacancies and softer asking-rent achievability than the comps imply.
- What's the recent tenant-quality profile in this submarket — average credit score on applications, eviction rate, late-payment / NSF rate, and stable-employment percentage? A property-management company in the area should have these aggregated.
- How much new for-sale + rental construction is in the pipeline within 1–3 miles? Heavy new supply typically softens prices + rents 12–24 months out; constrained supply supports both.
CashFlowRE · CFR-Z3T9SP28Q09GQ1
· Data 1 week ago
cashflowre.app · 2026-05-29