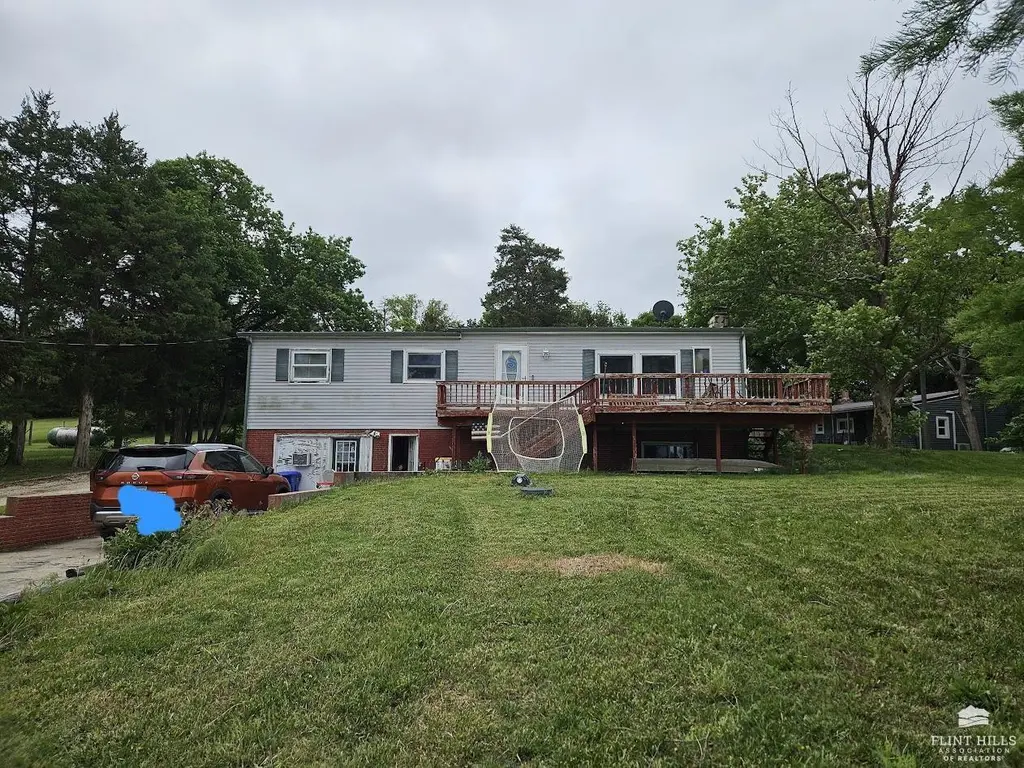
481 Sun Ln · Herington, KS
Flood risk 1/10 · Minimal
- FEMA flood zone
- —
- Chance of flooding over 30 yrs
- 0.0%
- Est. flood insurance / yr
- —
Fire risk 4/10 · Minor
- Est. fire insurance / yr
- $1,154 – $2,142
Heat risk 4/10 · Minor
- Hot days now (above 106°F)
- 7 days/yr
- Hot days in 30 yrs
- 16 days/yr
Wind risk 2/10 · Minimal
- Chance of severe wind over 30 yrs
- 1.0%
Air-quality risk 2/10 · Minimal
- Unhealthy air days now
- 1 days/yr
- Unhealthy air days in 30 yrs
- 1 days/yr
Risk factors via First Street. Map © Google.
Why this score? — see what drove the C+ grade
The composite is a weighted blend of 9 inputs, each scored 0–100. Each bar is that input's sub-score; the figure is the points it added to the 100-point composite (weight × sub-score).
- Cash flow +23.9/30.0
- DSCR +7.7/10.0
- ARV discount +7.5/15.0
- 1% rule +7.1/10.0
- Appreciation +5.1/10.0
- Livability +3.5/5.0
- Schools +2.6/10.0
- Rent growth +2.5/5.0
- Condition / age +2.5/5.0
$92,900
🖨 Deal sheet (PDF) 📄 Offer letter ✓ Due diligence
Key facts
- Outdoor recreation
- Front deck
- Screened-in porch
Tags
Property features AI
Finance
- HOA & community: Playground (association amenity)
Exterior
- Parking: Attached garage; Detached garage; Three garage spaces
- Utilities: Private well water; Propane service; Septic tank
- Home design: Manufactured home (single-family); One level above grade finished area reported
- Construction: Vinyl siding; Metal roof; Partially finished walk-out basement
- Exterior features: Privacy fence; Lake frontage/view; Garage(s) on property; Gravel road access
Interior
- Kitchen: Dishwasher; Oven; Range; Refrigerator
- Bedrooms: Three main-level bedrooms
- Flooring: Ceramic tile; Carpet; Laminate
- Bathrooms: Two full bathrooms; One half bathroom
- Heating & cooling: Central air; Ceiling fans; Electric heating; Propane heating; Baseboard heating; Wood stove
- Interior features: Ceiling fans; Wood-burning stove in family room; Water softener; Water purifier
- Laundry & utility: Washer/Dryer connections (washer and dryer not specified)
Neighborhood map
What this means for you Summary
Snapshot
- This is a 3-bed/2.5-bath single-family listed at $93k.
Deal economics
- At list price, monthly cash flow is $180 ($2k/yr) — positive.
- The deal already cash-flows at list — no discount required.
- Meets the 1% rule at list price ($1k rent vs $93k).
Location & tenants
- Location reads 70/100 on livability (#170 in KS) — a middle-class / working-renter tenant base. Strengths: cost of living A+, housing A+, health & safety A+; Watch: employment C-, amenities F, commute F.
- Herington (rural): math 28% / reading 33% proficiency, ranked #100 of 169 in KS (top 59%) — families likely to look elsewhere, expect single-tenant / working-renter base with shorter leases.
- Zoned schools: Herington Elem (math 42% / reading 42%, grade F, #273 of 684 statewide, top 45%, 187 students, 74% FRL); Herington Middle Sch (math 22% / reading 27%, grade F, #110 of 219 statewide, top 55%, 112 students, 74% FRL); Herington High (math 5% / reading 15%, grade F, #289 of 327 statewide, top 93%, 151 students, 60% FRL) — zoned schools average 70% FRL vs 49% district-wide (21 pts higher); higher-poverty schools than district average — tighter screening recommended.
- Market conditions: 29 active listings in the ZIP; 26 units permitted in Dickinson County in 2024 (0 in 5+ unit buildings).
Forward outlook
- In year one you build about $821 of equity ($642 loan paydown + $179 appreciation (0.2% local appreciation)).
- Dickinson County population projected at -12% by 2050 — secular population decline; favor cash flow + early exit over multi-decade hold.
- At projected returns (0.2% appreciation + 3.0% rent growth), your $26k cash investment doubles in ~7 years — after that, you're playing with house money.
Negotiation context
- Only 11 days on market — expect competitive offers; lowballing is unlikely to land.
Questions for the listing agent
- Built in 1971 — when were the roof, HVAC, electrical panel, plumbing, and water heater last replaced?
- Is there a deadline driving the sale (1031 exchange, divorce, estate, relocation)? That informs how much negotiation room exists.
- Schools are F-rated, which usually means shorter tenancies and higher turnover. Who's the typical renter profile here, and what's been the actual vacancy rate?
- What's the average days-on-market for RENTAL listings here right now (not sales)? A rising rental-DOM trend means longer vacancies and softer asking-rent achievability than the comps imply.
- What's the recent tenant-quality profile in this submarket — average credit score on applications, eviction rate, late-payment / NSF rate, and stable-employment percentage? A property-management company in the area should have these aggregated.
- How much new for-sale + rental construction is in the pipeline within 1–3 miles? Heavy new supply typically softens prices + rents 12–24 months out; constrained supply supports both.
Investment metrics
- 1% rule
- 1.21% ✓
- Cap rate
- 8.62%
- Cash-on-cash
- 8.29%
- DSCR
- 1.37
- GRM
- 6.9
CMA / ARV
No comps found within radius.
Projected returns pro-forma
0.19% appreciation · 3.0% rent growth · sell at horizon
- IRR
- 7.7%
- Equity multiple
- 1.37×
- Total profit
- $9,638
- Equity at exit
- $27,875
- IRR
- 12.6%
- Equity multiple
- 2.40×
- Total profit
- $36,530
- Equity at exit
- $34,233
Cash invested: $26,012 (down + closing). Projections, not guarantees.
Landlord ↔ Tenant lean methodology
- Overall (STATE)
- 83 Strongly Landlord-Friendly
- State Kansas
- 83 Strongly Landlord-Friendly · R+10
- County
- — inherits STATE
- City
- — inherits STATE
ZIP-level market 67449
- Home prices YoY
- 0.1%
- Active inventory
- 29
- Price-to-rent
- 6.9×
Monthly cashflow live
- Estimated rent
- $1,128 medium interval (Pro) →
- Mortgage (P&I)
- −$487
- Tax from tax record
- −$186 /mo · $2,230/yr
- Insurance
- −$39
- HOA
- −$0
- Lot rent
- −$0
- Vacancy / Maint / Mgmt
- −$237
- Net cashflow
- $180
Break-even live
Sensitivity live
| Price | -10% $232 | -5% $206 | +0% $180 | +5% $153 | +10% $127 |
|---|---|---|---|---|---|
| Rent | -10% $91 | -5% $135 | +0% $180 | +5% $224 | +10% $269 |
| Rate | -1.0pp $227 | -0.5pp $203 | base $180 | +0.5pp $156 | +1.0pp $131 |
UW: 25.0% down · 7.5% · 30yr · 1.5% tax · 5.0% vac · 8.0% maint · 8.0% mgmt
Financing live
Cash to close
- Down payment
- $23,225
- Closing costs
- $2,787
- Reserves months
- —
- Total cash needed
- —
Loan-product check · same deal, 3 products live
Conventional
25% down · 7.5% · 30yr
- Down + closing
- —
- Monthly P&I
- —
- Monthly cashflow
- —
- DSCR
- —
- Eligible?
- —
Personal DTI + credit; lowest rate.
DSCR
20% down · 8.5% · 30yr
- Down + closing
- —
- Monthly P&I
- —
- Monthly cashflow
- —
- DSCR
- —
- Eligible?
- —
No personal income docs; deal must DSCR.
Hard money
10% down · 12.0% · 12mo
- Down + closing
- —
- Monthly P&I
- —
- Monthly cashflow
- —
- DSCR
- —
- Eligible?
- —
Short-term bridge; refi at stabilization.
Listing history 7 events
-
2026-06-12days on market $92,900 Active 11 DOM
-
2026-06-09days on market $92,900 Active 8 DOM
-
2026-06-08days on market $92,900 Active 7 DOM
-
2026-06-07days on market $92,900 Active 6 DOM
-
2026-06-05days on market $92,900 Active 4 DOM
-
2026-06-04days on market $92,900 Active 2 DOM
-
2026-06-02$92,900 Active 1 DOM
ⓘ Source: listings_history table (triggers on properties + properties_extension) + one-shot
backfill from property_details.listing_events for pre-trigger history.
Tax reassessment forecast KS · Resets to sale price
- Current annual tax
- $2,230 · $186/mo
- Projected year-2 tax
- $2,230 · $186/mo
- Expected delta
- $0/yr ($0/mo · 0.0%)
ⓘ Screening estimate from a state-policy table — verify with the county assessor before closing.
Climate risk First Street
- Flood 1/10 Low 0% chance over 30 yrs
- Wildfire 4/10 Moderate
- Heat 4/10 Moderate 7 d/yr ≥106°F today · 16 d/yr by 30 yrs out
- Wind 2/10 Low 100% chance of damaging wind over 30 yrs
- Air quality 2/10 Low 1 unhealthy d/yr today · 1 by 30 yrs out
Nearby sold comps map
Loading sold comps map…
Walkable amenities ~0.75 mi
Loading nearby amenities…
Taxation est. · year 1
- Rental income
- $13,541
- − Mortgage interest
- −$5,204
- − Property taxes
- −$2,230
- − Insurance
- −$464
- − Repairs & maintenance
- −$1,083
- − Management
- −$1,083
- − Depreciation
- −$2,703
- Taxable income
- $774
- Est. tax owed @ 24.0%
- −$186
- After-tax cash flow
- $1,972/yr
For passive investors: Depreciation is non-cash, so a rental often shows a tax loss while cash-flowing — sheltering income. Rental losses are passive: they offset passive income freely, and up to $25,000/yr can offset ordinary (W-2) income if you actively participate and your MAGI is under $100k (phasing out to $0 by $150k); unused losses carry forward. On sale, claimed depreciation is recaptured at up to 25%, and gains may owe capital-gains tax (a 1031 exchange can defer both). Figures are a year-1 estimate at your 24.0% rate — not tax advice; consult a CPA.
Schools (NCES district)
- District
- Herington
- NCES district ID
- 2007110
- Math proficiency
- 28% ▼ -1.00%
- Reading proficiency
- 33% ▼ -2.00%
- Median HH income
- $39,012
- Composite
- 25.55/100
- National rank
- #7429
- State rank
- #100 of 169 in KS
Livability — Herington
- Score
- 70/100
- State rank
- #170
- US rank
- #8052
Category grades
Schools grade is shown separately in the Schools card above.
Census & demographics
- Population (ZIP)
- 2,756
Population outlook (Dickinson County) Hauer SSP2
- Today (2025)
- 18,727 people
- By 2030
- 18,312 · -2.2%
- By 2040
- 17,433 · -6.9%
- By 2050
- 16,493 · -11.9%
- By 2075
- 14,441 · -22.9%
- By 2100
- 11,707 · -37.5%
Race, ethnicity, and origin ACS 2023
- Neighborhood character
- Predominantly White (84%)
- Race & ethnicity
- White 84% Two or more races 8% Hispanic / Latino 8%
- Hispanic origin (detail)
- Mexican 4% Puerto Rican 4%
- Common ancestry
- Italian 3% Slovak 2% Romanian 2%
- Foreign-born
- 0% · Canada
- Languages at home
- 96% English-only · Spanish 4%
Political lean MEDSL · Dickinson
- 2024 margin
- Solid R (+55.0) · D 21.8% · R 76.7% · Other 1.5%
- 2008→2024 swing
- -12.8pp toward R · 2008: -42.2pp · 2024: -55.0pp
- All cycles
- 2024: R+55.0 2020: R+54.1 2016: R+54.0 2012: R+47.7 2008: R+42.2
Not yet ingested
- Civics
- —
Market trends
- HPI YoY
- ▲ 0.19%
- Current HPI
- 146.5368
- Rent YoY
- —
- Metro
- —
- State GDP YoY
- —
- F500 in state
- 0
Price history
+9.3% since first listed2 events — show timeline
- 2026-06-01 Listed $92,900 FHAOR as distributed by MLS GRID
- 2006-05-01 Sold (Public Records) $85,000 Public Records
Property tax history
+2.3%/yrLatest (2025): $2,230 · +1.8% YoY. Source: county tax records.
Cash-flow waterfall
monthlySold comps — $/sqft
last 12 mo · ≤1 miLoading sold comps…