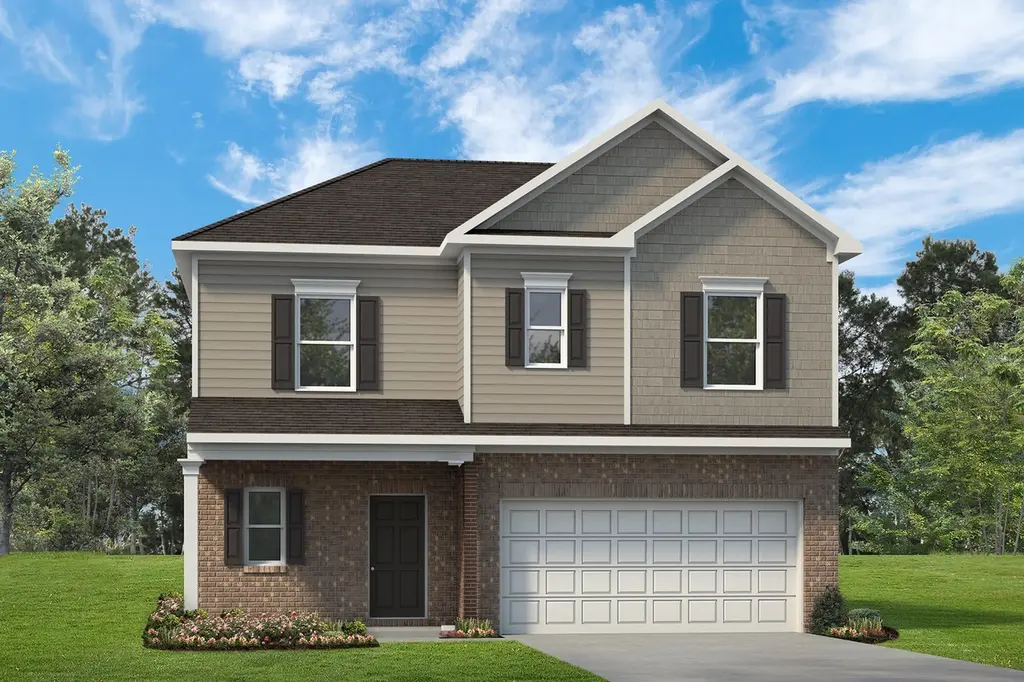
The Benson II Plan
Weston Lakes, TX 77441
$295,990F
3 bd · 2.5 ba ·
1,860 sqft ·
Built —
· SingleFamily
· Active
· 747 DOM
Cashflow @ list (25.0% down · 7.5%)
Estimated rent
$2,383/mo
Mortgage (P&I)
−$1,783
Tax + insurance
−$567
HOA
−$0
Vac / Maint / Mgmt
−$500
Net cashflow
$-467/mo
Annual
$-5,599/yr
Cap rate
4.65%
Cash-on-cash
-5.88%
DSCR
0.74
1% rule
0.70%
Cash to close
$95,185
Investor read
- This is a 3-bed/2.5-bath single-family listed at $296k.
- At list price, monthly cash flow is $-467 ($-6k/yr) — negative.
- To cash-flow at today's rent, offer at most $272k (8.0% below list).
- To meet the 1% rule (rent ≥ 1% of price), the offer needs to be $238k (19.5% below list).
- It's been on market 747 days — a 12% lower offer ($260k) is reasonable based on typical stale-listing flexibility.
- Recommended offer: $238k (19.5% below list) — sets the bar for 1% rule.
- Local home prices are declining (-3.0%/yr); year-one equity from $2k of loan paydown is wiped out by about $10k of value loss. Plan a longer hold.
- Location reads 59/100 on livability (#1,122 in TX) — a working-class tenant base; expect higher turnover. Strengths: crime A+, employment A+, housing A+; Watch: amenities F, commute F, cost of living F.
- Lamar CISD (suburban): math 50% / reading 53% proficiency, ranked #116 of 826 in TX (top 14%) — acceptable for families but not a draw, mixed tenant base, ~2y average lease.
- Zoned schools: Huggins El (math 61% / reading 63%, grade B, #321 of 4,322 statewide, top 8%, 893 students, 23% FRL); Briscoe J H (math 59% / reading 60%, grade B, #166 of 1,662 statewide, top 11%, 1,914 students, 38% FRL); Foster H S (math 64% / reading 74%, grade B, #141 of 1,632 statewide, top 9%, 2,388 students, 34% FRL).
- Zoned-school proficiency averages 64% at this address vs 52% district-wide (+12 pts) — the actual schools serving this property are materially stronger than the Lamar CISD average implies; a family-tenant draw the district grade alone would hide.
- Market conditions: Rents soft (-1.6%/yr); 1242 active listings in the ZIP; 1 comparable units currently listed for rent nearby; high-income renter base; 12,093 units permitted in Fort Bend County in 2024 (815 in 5+ unit buildings).
- Fort Bend County population projected at +75% by 2050 — long-run rental-demand tailwind backs the buy-and-hold thesis.
- Cap rate 4.6% vs local median 1.5% in Weston Lakes — top-decile yield for the area; either an underpriced asset or a hidden risk that comps aren't pricing in. Stress-test before assuming the spread holds.
- This rent is only 16% of the median local income ($184k/yr) — well below the 30% rent-burden line; pricing power to push rent on renewal without tenant pushback.
Questions for listing agent
- What do current leases actually rent for vs. the listed asking? Can we see a recent rent roll and the last 12 months of T-12 income?
- It's been on market 747 days. Have you received any prior offers? Is the seller open to a 19% concession, seller financing, or rate buy-down credit?
- Why hasn't it sold? Are there any deal-killer items the seller is aware of (foundation, flood, title, zoning, code violations)?
- Is there a deadline driving the sale (1031 exchange, divorce, estate, relocation)? That informs how much negotiation room exists.
- The area grade is low — what's the realistic commute time and amenity access for the typical tenant pool here? Any planned neighborhood developments (good or bad) we should know about?
- What's the average days-on-market for RENTAL listings here right now (not sales)? A rising rental-DOM trend means longer vacancies and softer asking-rent achievability than the comps imply.
- What's the recent tenant-quality profile in this submarket — average credit score on applications, eviction rate, late-payment / NSF rate, and stable-employment percentage? A property-management company in the area should have these aggregated.
- How much new for-sale + rental construction is in the pipeline within 1–3 miles? Heavy new supply typically softens prices + rents 12–24 months out; constrained supply supports both.
CashFlowRE · CFR-Z74MJ52W0B477P
· Data 1 day ago
cashflowre.app · 2026-05-29