 🏗️ New Construction
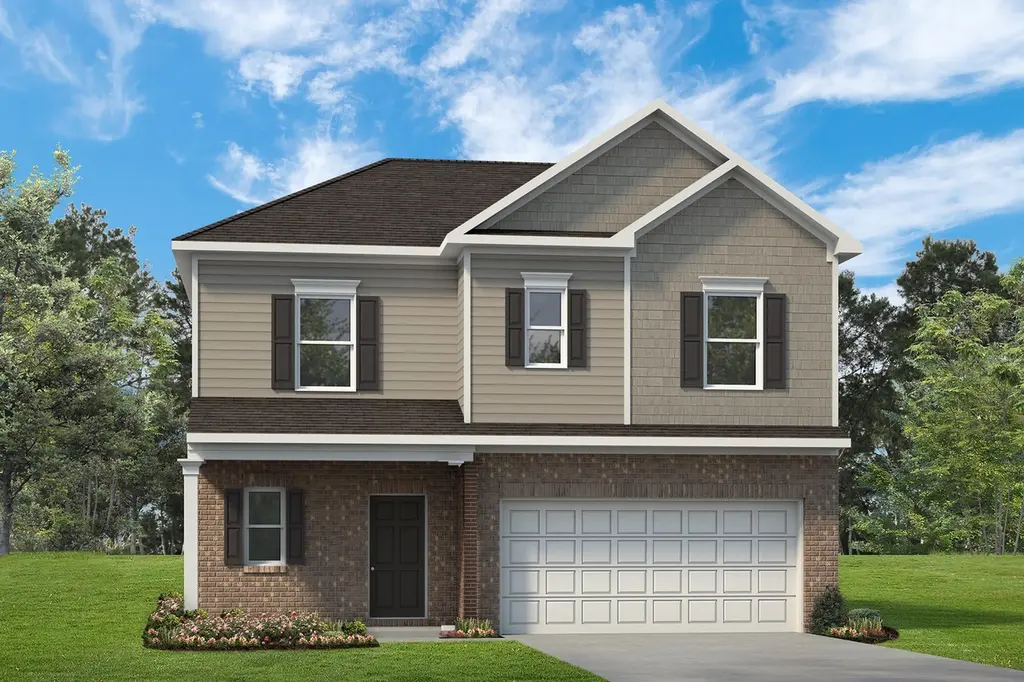
The Benson II Plan · Weston Lakes, TX
Flood risk No data
- FEMA flood zone
- —
- Chance of flooding over 30 yrs
- —
- Est. flood insurance / yr
- —
Fire risk No data
- Est. fire insurance / yr
- —
Heat risk No data
- Hot days now (above threshold)
- —
- Hot days in 30 yrs
- —
Wind risk No data
- Chance of severe wind over 30 yrs
- —
Air-quality risk No data
- Unhealthy air days now
- —
- Unhealthy air days in 30 yrs
- —
Risk factors via First Street. Map © Google.
Why this score? — see what drove the F grade
The composite is a weighted blend of 9 inputs, each scored 0–100. Each bar is that input's sub-score; the figure is the points it added to the 100-point composite (weight × sub-score).
- ARV discount +7.5/15.0
- Cash flow +7.2/30.0
- Schools +4.6/10.0
- Livability +3.0/5.0
- Condition / age +2.5/5.0
- Rent growth +2.1/5.0
- 1% rule +2.0/10.0
- DSCR +1.4/10.0
- Appreciation +0.0/10.0
$295,990
🖨 Deal sheet (PDF) 📄 Offer letter ✓ Due diligence
Listing remarks MLS
A wide, light-filled entry welcomes you into the Benson II and leads to a connected living-dining-kitchen layout that spans the entire width of the home. Its well-designed kitchen maximizes efficiency with a countertop workspace, a center island with a sink, a pantry, and an optional planning desk. Upstairs, you'll find the owner's ensuite with a spacious closet, two additional bedrooms, a bath with a conveniently located laundry room, and a loft with a storage closet that can be optioned to a fourth bedroom.
Key facts
- Spacious closet
- 2 parking spots
- Listed 747 days
Tags
Neighborhood map
What this means for you Summary
Snapshot
- This is a 3-bed/2.5-bath single-family listed at $296k.
Deal economics
- At list price, monthly cash flow is $-467 ($-6k/yr) — negative.
- To cash-flow at today's rent, offer at most $272k (8.0% below list).
- To meet the 1% rule (rent ≥ 1% of price), the offer needs to be $238k (19.5% below list).
- Recommended offer: $238k (19.5% below list) — sets the bar for 1% rule.
- Cap rate 4.6% vs local median 1.5% in Weston Lakes — top-decile yield for the area; either an underpriced asset or a hidden risk that comps aren't pricing in. Stress-test before assuming the spread holds.
Location & tenants
- Location reads 59/100 on livability (#1,122 in TX) — a working-class tenant base; expect higher turnover. Strengths: crime A+, employment A+, housing A+; Watch: amenities F, commute F, cost of living F.
- Lamar CISD (suburban): math 50% / reading 53% proficiency, ranked #116 of 826 in TX (top 14%) — acceptable for families but not a draw, mixed tenant base, ~2y average lease.
- Zoned schools: Huggins El (math 61% / reading 63%, grade B, #321 of 4,322 statewide, top 8%, 893 students, 23% FRL); Briscoe J H (math 59% / reading 60%, grade B, #166 of 1,662 statewide, top 11%, 1,914 students, 38% FRL); Foster H S (math 64% / reading 74%, grade B, #141 of 1,632 statewide, top 9%, 2,388 students, 34% FRL).
- Zoned-school proficiency averages 64% at this address vs 52% district-wide (+12 pts) — the actual schools serving this property are materially stronger than the Lamar CISD average implies; a family-tenant draw the district grade alone would hide.
- Market conditions: Rents soft (-1.6%/yr); 1242 active listings in the ZIP; 1 comparable units currently listed for rent nearby; high-income renter base; 12,093 units permitted in Fort Bend County in 2024 (815 in 5+ unit buildings).
- This rent is only 16% of the median local income ($184k/yr) — well below the 30% rent-burden line; pricing power to push rent on renewal without tenant pushback.
Forward outlook
- Local home prices are declining (-3.0%/yr); year-one equity from $2k of loan paydown is wiped out by about $10k of value loss. Plan a longer hold.
- Fort Bend County population projected at +75% by 2050 — long-run rental-demand tailwind backs the buy-and-hold thesis.
Negotiation context
- It's been on market 747 days — a 12% lower offer ($260k) is reasonable based on typical stale-listing flexibility.
Questions for the listing agent
- What do current leases actually rent for vs. the listed asking? Can we see a recent rent roll and the last 12 months of T-12 income?
- It's been on market 747 days. Have you received any prior offers? Is the seller open to a 19% concession, seller financing, or rate buy-down credit?
- Why hasn't it sold? Are there any deal-killer items the seller is aware of (foundation, flood, title, zoning, code violations)?
- Is there a deadline driving the sale (1031 exchange, divorce, estate, relocation)? That informs how much negotiation room exists.
- The area grade is low — what's the realistic commute time and amenity access for the typical tenant pool here? Any planned neighborhood developments (good or bad) we should know about?
- What's the average days-on-market for RENTAL listings here right now (not sales)? A rising rental-DOM trend means longer vacancies and softer asking-rent achievability than the comps imply.
- What's the recent tenant-quality profile in this submarket — average credit score on applications, eviction rate, late-payment / NSF rate, and stable-employment percentage? A property-management company in the area should have these aggregated.
- How much new for-sale + rental construction is in the pipeline within 1–3 miles? Heavy new supply typically softens prices + rents 12–24 months out; constrained supply supports both.
Investment metrics
- 1% rule
- 0.70% ✗
- Cap rate
- 4.65%
- Cash-on-cash
- -5.88%
- DSCR
- 0.74
- GRM
- 11.9
CMA / ARV
- ARV (median comp)
- $339,947
- List price
- $295,990
- Delta
- -12.93%
- Verdict
- UNDERPRICED
- Comps
- 20 within 1.0 mi
Show comp detail 12 sales within ~0.75 mi
| Address | Dist | Beds/Ba | Sqft | Sold | Price | $/sf | Match |
|---|---|---|---|---|---|---|---|
| 8126 Red Shiner Way | 0.16mi | 3/2.0 | 1,826 (-2%) | 4mo | $340,670 | $187 | 84 |
| 8315 Red Shiner Way | 0.22mi | 3/2.0 | 1,826 (-2%) | 1mo | $318,990 | $175 | 84 |
| 8130 Red Shiner Way | 0.16mi | 3/2.0 | 1,924 (+3%) | 2mo | $285,000 | $148 | 83 |
| 8135 Red Shiner Way | 0.18mi | 4/2.0 (+1) | 1,897 (+2%) | 3mo | $359,895 | $190 | 79 |
| 32438 Slender Spreadwing Dr | 0.30mi | 4/2.0 (+1) | 1,897 (+2%) | 2mo | $348,275 | $184 | 74 |
| 7902 Wandering Glider Dr | 0.31mi | 4/2.0 (+1) | 1,897 (+2%) | 4mo | $354,760 | $187 | 72 |
| 32310 Comet Darner Way | 0.19mi | 4/2.5 (+1) | 1,749 (-6%) | 5mo | $344,900 | $197 | 72 |
| 32303 Comet Darner Way | 0.24mi | 4/2.0 (+1) | 1,925 (+4%) | 7mo | $300,000 | $156 | 70 |
| 32307 Comet Darner Way | 0.22mi | 3/2.0 | 1,673 (-10%) | 1mo | $334,900 | $200 | 70 |
| 8319 Red Shiner Way | 0.22mi | 3/2.0 | 1,710 (-8%) | 5mo | $324,975 | $190 | 70 |
| 8014 Wandering Glider Dr | 0.38mi | 3/2.0 | 1,640 (-12%) | 1mo | $324,990 | $198 | 60 |
| 8034 Wandering Glider Dr | 0.42mi | 3/2.0 | 1,640 (-12%) | 2mo | $324,155 | $198 | 57 |
Match score weights: distance 35% · size 25% · config 20% · recency 20%. Top-matched comps best support the ARV.
Projected returns pro-forma
-3.0% appreciation · 0.0% rent growth · sell at horizon
- IRR
- -29.8%
- Equity multiple
- 0.04×
- Total profit
- $-91,753
- Equity at exit
- $50,687
- IRR
- -49.7%
- Equity multiple
- -0.52×
- Total profit
- $-145,008
- Equity at exit
- $29,392
Cash invested: $95,185 (down + closing). Projections, not guarantees.
Landlord ↔ Tenant lean methodology
- Overall (STATE)
- 87 Strongly Landlord-Friendly
- State Texas
- 87 Strongly Landlord-Friendly · R+5
- County
- — inherits STATE
- City
- — inherits STATE
ZIP-level market 77441
- Rents YoY
- -1.6%
- Active inventory
- 1242
- Price-to-rent
- 10.4×
Monthly cashflow live
- Estimated rent
- $2,383 medium interval (Pro) →
- Mortgage (P&I)
- −$1,783
- Tax est. 1.5%
- −$425 /mo · $5,099/yr
- Insurance
- −$142
- HOA
- −$0
- Vacancy / Maint / Mgmt
- −$500
- Net cashflow
- $-467
Break-even live
Sensitivity live
| Price | -10% $-232 | -5% $-349 | +0% $-467 | +5% $-584 | +10% $-702 |
|---|---|---|---|---|---|
| Rent | -10% $-655 | -5% $-561 | +0% $-467 | +5% $-372 | +10% $-278 |
| Rate | -1.0pp $-295 | -0.5pp $-380 | base $-467 | +0.5pp $-555 | +1.0pp $-644 |
UW: 25.0% down · 7.5% · 30yr · 1.5% tax · 5.0% vac · 8.0% maint · 8.0% mgmt
Financing live
Cash to close
- Down payment
- $84,987
- Closing costs
- $10,198
- Reserves months
- —
- Total cash needed
- —
Loan-product check · same deal, 3 products live
Conventional
25% down · 7.5% · 30yr
- Down + closing
- —
- Monthly P&I
- —
- Monthly cashflow
- —
- DSCR
- —
- Eligible?
- —
Personal DTI + credit; lowest rate.
DSCR
20% down · 8.5% · 30yr
- Down + closing
- —
- Monthly P&I
- —
- Monthly cashflow
- —
- DSCR
- —
- Eligible?
- —
No personal income docs; deal must DSCR.
Hard money
10% down · 12.0% · 12mo
- Down + closing
- —
- Monthly P&I
- —
- Monthly cashflow
- —
- DSCR
- —
- Eligible?
- —
Short-term bridge; refi at stabilization.
Rent comps 1 comps
| Address | Beds | Baths | Sqft | Rent | $/sqft | DOM | Units | Dist |
|---|---|---|---|---|---|---|---|---|
| 31419 Horseshoe Meadow Bend Ln Fulshear, TX | 3.0 | 2.0 | 1588 | $2,100 | $1.32 | 45d | 1 | 1.39mi |
Listing history 20 events
-
2026-06-21days on market $295,990 Active 747 DOM
-
2026-06-18days on market $295,990 Active 744 DOM
-
2026-06-17days on market $295,990 Active 743 DOM
-
2026-06-16days on market $295,990 Active 742 DOM
-
2026-06-15days on market $295,990 Active 741 DOM
-
2026-06-13days on market $295,990 Active 739 DOM
-
2026-06-10days on market $295,990 Active 735 DOM
-
2026-06-08days on market $295,990 Active 734 DOM
-
2026-06-07days on market $295,990 Active 733 DOM
-
2026-06-04days on market $295,990 Active 730 DOM
-
2026-06-03days on market $295,990 Active 729 DOM
-
2026-06-02days on market $295,990 Active 728 DOM
-
2026-06-01days on market $295,990 Active 727 DOM
-
2026-05-31days on market $295,990 Active 726 DOM
-
2026-01-16price $295,990 514-char remark
Show marketing remark (514 chars)
A wide, light-filled entry welcomes you into the Benson II and leads to a connected living-dining-kitchen layout that spans the entire width of the home. Its well-designed kitchen maximizes efficiency with a countertop workspace, a center island with a sink, a pantry, and an optional planning desk. Upstairs, you'll find the owner's ensuite with a spacious closet, two additional bedrooms, a bath with a conveniently located laundry room, and a loft with a storage closet that can be optioned to a fourth bedroom.
-
2025-08-01price $293,990 514-char remark
Show marketing remark (514 chars)
A wide, light-filled entry welcomes you into the Benson II and leads to a connected living-dining-kitchen layout that spans the entire width of the home. Its well-designed kitchen maximizes efficiency with a countertop workspace, a center island with a sink, a pantry, and an optional planning desk. Upstairs, you'll find the owner's ensuite with a spacious closet, two additional bedrooms, a bath with a conveniently located laundry room, and a loft with a storage closet that can be optioned to a fourth bedroom.
-
2025-02-04price $291,990 514-char remark
Show marketing remark (514 chars)
A wide, light-filled entry welcomes you into the Benson II and leads to a connected living-dining-kitchen layout that spans the entire width of the home. Its well-designed kitchen maximizes efficiency with a countertop workspace, a center island with a sink, a pantry, and an optional planning desk. Upstairs, you'll find the owner's ensuite with a spacious closet, two additional bedrooms, a bath with a conveniently located laundry room, and a loft with a storage closet that can be optioned to a fourth bedroom.
-
2024-12-11price $300,990 514-char remark
Show marketing remark (514 chars)
A wide, light-filled entry welcomes you into the Benson II and leads to a connected living-dining-kitchen layout that spans the entire width of the home. Its well-designed kitchen maximizes efficiency with a countertop workspace, a center island with a sink, a pantry, and an optional planning desk. Upstairs, you'll find the owner's ensuite with a spacious closet, two additional bedrooms, a bath with a conveniently located laundry room, and a loft with a storage closet that can be optioned to a fourth bedroom.
-
2024-07-03price $310,990 514-char remark
Show marketing remark (514 chars)
A wide, light-filled entry welcomes you into the Benson II and leads to a connected living-dining-kitchen layout that spans the entire width of the home. Its well-designed kitchen maximizes efficiency with a countertop workspace, a center island with a sink, a pantry, and an optional planning desk. Upstairs, you'll find the owner's ensuite with a spacious closet, two additional bedrooms, a bath with a conveniently located laundry room, and a loft with a storage closet that can be optioned to a fourth bedroom.
-
2024-06-04$305,990 Active 514-char remark
Show marketing remark (514 chars)
A wide, light-filled entry welcomes you into the Benson II and leads to a connected living-dining-kitchen layout that spans the entire width of the home. Its well-designed kitchen maximizes efficiency with a countertop workspace, a center island with a sink, a pantry, and an optional planning desk. Upstairs, you'll find the owner's ensuite with a spacious closet, two additional bedrooms, a bath with a conveniently located laundry room, and a loft with a storage closet that can be optioned to a fourth bedroom.
ⓘ Source: listings_history table (triggers on properties + properties_extension) + one-shot
backfill from property_details.listing_events for pre-trigger history.
Nearby sold comps map
Loading sold comps map…
Walkable amenities ~0.75 mi
Loading nearby amenities…
Taxation est. · year 1
- Rental income
- $28,598
- − Mortgage interest
- −$19,042
- − Property taxes
- −$5,099
- − Insurance
- −$1,700
- − Repairs & maintenance
- −$2,288
- − Management
- −$2,288
- − Depreciation
- −$9,889
- Taxable loss
- −$11,708
- Est. tax savings @ 24.0%
- +$2,810
- After-tax cash flow
- $-2,789/yr
For passive investors: Depreciation is non-cash, so a rental often shows a tax loss while cash-flowing — sheltering income. Rental losses are passive: they offset passive income freely, and up to $25,000/yr can offset ordinary (W-2) income if you actively participate and your MAGI is under $100k (phasing out to $0 by $150k); unused losses carry forward. On sale, claimed depreciation is recaptured at up to 25%, and gains may owe capital-gains tax (a 1031 exchange can defer both). Figures are a year-1 estimate at your 24.0% rate — not tax advice; consult a CPA.
Schools (NCES district)
- District
- Lamar CISD
- NCES district ID
- 4826580
- Math proficiency
- 50% ▼ -12.00%
- Reading proficiency
- 53% ▼ -4.00%
- Median HH income
- $75,213
- Composite
- 46.43/100
- National rank
- #2452
- State rank
- #116 of 826 in TX
Livability — Weston Lakes
- Score
- 59/100
- State rank
- #1122
- US rank
- #19641
Category grades
Schools grade is shown separately in the Schools card above.
Census & demographics
- County
- Fort Bend County · 836,777 people
- Metro
- Houston-The Woodlands-Sugar Land, TX
- Population (ZIP)
- 41,324
- Household income
- $184,390
- Rent vs Own
- Severe rent burden
- 301.0
Population outlook (Fort Bend County) Hauer SSP2
- Today (2025)
- 1,004,526 people
- By 2030
- 1,153,104 · +14.8%
- By 2040
- 1,453,718 · +44.7%
- By 2050
- 1,753,781 · +74.6%
- By 2075
- 2,455,772 · +144.5%
- By 2100
- 2,930,528 · +191.7%
Race, ethnicity, and origin ACS 2023
- Neighborhood character
- Diverse neighborhood (Simpson 0.62)
- Race & ethnicity
- White 57% Hispanic / Latino 20% Two or more races 15% Asian 12% Black 6%
- Hispanic origin (detail)
- Mexican 10%
- Common ancestry
- Lithuanian 5% Romanian 2% Italian 1%
- Foreign-born
- 26% · Canada, China, Jamaica
- Languages at home
- 68% English-only · Spanish 17% German/W. Germanic 4% Chinese 4%
Political lean MEDSL · Fort Bend
- 2024 margin
- Toss-up / Even · D 49.5% · R 47.9% · Other 2.6%
- 2008→2024 swing
- +4.0pp toward D · 2008: -2.4pp · 2024: 1.6pp
- All cycles
- 2024: D+1.6 2020: D+10.6 2016: D+6.6 2012: R+6.8 2008: R+2.4
Not yet ingested
- Civics
- —
Market trends
- HPI YoY
- ▼ -154.74%
- Current HPI
- 275.8798
- Rent YoY
- ▼ -1.63%
- Metro
- Houston-The Woodlands-Sugar Land, TX
- State GDP YoY
- ▲ 3.95%
- F500 in state
- 110
Industry mix (Fortune 500 HQ in TX)
| Industry | F500 HQs | Revenue |
|---|---|---|
| Energy | 16 | $1,198B |
|
||
| Technology | 5 | $198B |
|
||
| Engineering / Construction | 4 | $72B |
|
||
| Energy Services | 3 | $60B |
|
||
| Utilities | 3 | $41B |
|
||
| Healthcare | 2 | $330B |
|
||
Price history
-3.3% since first listed6 events — show timeline
- 2026-01-16 Price Changed $295,990 Zillow
- 2025-08-01 Price Changed $293,990 Zillow
- 2025-02-04 Price Changed $291,990 Zillow
- 2024-12-11 Price Changed $300,990 Zillow
- 2024-07-03 Price Changed $310,990 Zillow
- 2024-06-04 Listed $305,990 Zillow
Cash-flow waterfall
monthlySold comps — $/sqft
last 12 mo · ≤1 miLoading sold comps…