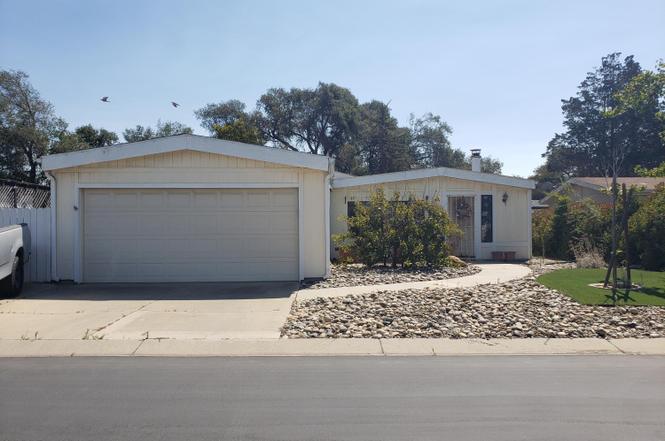
3822 Cherry Hill Rd
Orcutt, CA 93455
$98,000B
2 bd · 2.0 ba ·
1,584 sqft ·
Built 1981
· Manufactured
· Active
· 272 DOM
Cashflow @ list (25.0% down · 7.5%)
Estimated rent
$2,416/mo
Mortgage (P&I)
−$514
Tax + insurance
−$163
HOA
−$250
Vac / Maint / Mgmt
−$507
Net cashflow
$981/mo
Annual
$11,775/yr
Cap rate
18.31%
Cash-on-cash
42.91%
DSCR
2.91
1% rule
2.47%
Cash to close
$27,440
Investor read
- This is a 2-bed/2.0-bath manufactured listed at $98k.
- At list price, monthly cash flow is $981 ($12k/yr) — positive.
- The deal already cash-flows at list — no discount required.
- Meets the 1% rule at list price ($2k rent vs $98k).
- It's been on market 272 days — a 12% lower offer ($86k) is reasonable based on typical stale-listing flexibility.
- Recommended offer: $86k (12.0% below list) — sets the bar for market timing.
- Local home prices are declining (-3.0%/yr); year-one equity from $678 of loan paydown is wiped out by about $3k of value loss. Plan a longer hold.
- Location reads 73/100 on livability (#169 in CA) — a middle-class / working-renter tenant base. Strengths: commute A+, employment A+, housing A+; Watch: crime D+, cost of living F.
- Orcutt Union Elementary (suburban): math 44% / reading 54% proficiency, ranked #414 of 1,400 in CA (top 30%) — families likely to look elsewhere, expect single-tenant / working-renter base with shorter leases.
- Zoned schools: Alice Shaw Elementary (511 students, 53% FRL); Lakeview Junior High (442 students, 46% FRL); Ernest Righetti High (2,494 students, 64% FRL) — zoned schools average 54% FRL vs 30% district-wide (24 pts higher); higher-poverty schools than district average — tighter screening recommended.
- Market conditions: Rents rising (+2.2%/yr); 121 active listings in the ZIP; 2 comparable units currently listed for rent nearby; high-income renter base; 719 units permitted in Santa Barbara County in 2024 (217 in 5+ unit buildings).
- Santa Barbara County population projected at +20% by 2050 — long-run rental-demand tailwind backs the buy-and-hold thesis.
- 4 sale attempts since 29y ago with the ask held roughly flat each time — persistent listings suggest the price (not the market) is what's stuck; bring a comps-based counter.
- At projected returns (-3.0% appreciation + 2.2% rent growth), your $27k cash investment doubles in ~3 years — after that, you're playing with house money.
- Cap rate 18.3% vs local median 2.6% in Orcutt — top-decile yield for the area; either an underpriced asset or a hidden risk that comps aren't pricing in. Stress-test before assuming the spread holds.
Questions for listing agent
- It's been on market 272 days. Have you received any prior offers? Is the seller open to a 12% concession, seller financing, or rate buy-down credit?
- What does the HOA fee cover, when was the last increase, and are there any pending special assessments or reserve-fund shortfalls?
- Why hasn't it sold? Are there any deal-killer items the seller is aware of (foundation, flood, title, zoning, code violations)?
- Is there a deadline driving the sale (1031 exchange, divorce, estate, relocation)? That informs how much negotiation room exists.
- Schools are B-rated — typically a magnet for longer-tenancy family renters. What's the average tenant stay here, and is there a school-zone premium baked into asking?
- Crime grade is D in this area — have there been break-ins, vandalism, or insurance claims at this property in the last 3 years? What carrier currently insures it and at what premium?
- What's the average days-on-market for RENTAL listings here right now (not sales)? A rising rental-DOM trend means longer vacancies and softer asking-rent achievability than the comps imply.
- What's the recent tenant-quality profile in this submarket — average credit score on applications, eviction rate, late-payment / NSF rate, and stable-employment percentage? A property-management company in the area should have these aggregated.
CashFlowRE · CFR-Z7YXSKBSE6GM4H
· Data 1 day ago
cashflowre.app · 2026-05-29