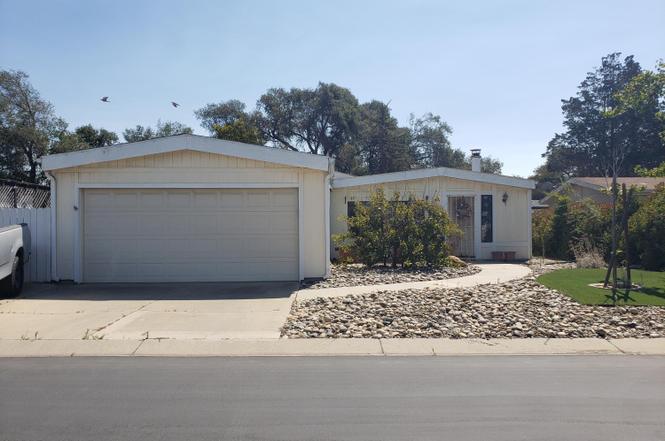
3822 Cherry Hill Rd · Orcutt, CA
Flood risk 1/10 · Minimal
- FEMA flood zone
- X (unshaded)
- Chance of flooding over 30 yrs
- 0.0%
- Est. flood insurance / yr
- $507 – $1,088
Fire risk 4/10 · Minor
- Est. fire insurance / yr
- $659 – $1,223
Heat risk 3/10 · Minor
- Hot days now (above 87°F)
- 7 days/yr
- Hot days in 30 yrs
- 16 days/yr
Wind risk 1/10 · Minimal
- Chance of severe wind over 30 yrs
- —
Air-quality risk 6/10 · Moderate
- Unhealthy air days now
- 8 days/yr
- Unhealthy air days in 30 yrs
- 10 days/yr
Risk factors via First Street. Map © Google.
Why this score? — see what drove the B grade
The composite is a weighted blend of 9 inputs, each scored 0–100. Each bar is that input's sub-score; the figure is the points it added to the 100-point composite (weight × sub-score).
- Cash flow +30.0/30.0
- 1% rule +10.0/10.0
- DSCR +10.0/10.0
- ARV discount +7.5/15.0
- Schools +4.6/10.0
- Livability +3.7/5.0
- Rent growth +3.1/5.0
- Condition / age +2.5/5.0
- Appreciation +0.0/10.0
$98,000
🖨 Deal sheet (PDF) 📄 Offer letter ✓ Due diligence
Listing remarks MLS
Fabulous Triplewide Home With Real Hardwood Floors! Bright Cheery Interior, Large Master Suite, Great Modern Kitchen With Room For Kitchen Table, Indoor Laundry, Wet Bar, Fireplace, Stained Glass, Secluded Backyard, All Appliances Included. Add Your Personal Touches And Call The Movers! Land May Be Purchased Thereby Eliminating Space Rent.
Key facts
- Built in hutch
- Wet bar
- Secluded back yard
Tags
Property features AI
Finance
- Other: Building area approx. 1,584 (appraiser source)
- HOA & community: Association fee $250 monthly; Association includes common area maintenance; Community amenities: Pool, Clubhouse
Exterior
- Parking: Attached 2-car garage; Drive space; No street parking
- Utilities: Public water; Public sewer; Cable available
- Home design: Manufactured home; Single-level entry (manufactured design)
- Construction: Vinyl siding; Composition roof; Pilings / pillar/post/pier foundation; Model: 304X (Pacific Living Sys)
- Exterior features: Patio (covered); Fenced yard; Sidewalks
Interior
- Kitchen: Gas cooktop; Oven; Dishwasher; Garbage disposal; Refrigerator
- Bedrooms: Age-restricted community (adult community) — pets allowed
- Flooring: Carpet; Wood; Vinyl
- Bathrooms: 2 full bathrooms
- Heating & cooling: Forced air heating; Ceiling fan(s); Additional cooling (other)
- Interior features: Pantry; Cathedral ceilings; Wet bar; Free standing gas fireplace with gas jets in the living room
- Laundry & utility: Washer hookup (inside); Dryer included; Gas hookup for laundry
Neighborhood map
What this means for you Summary
Snapshot
- This is a 2-bed/2.0-bath manufactured listed at $98k.
Deal economics
- At list price, monthly cash flow is $2k ($19k/yr) — positive.
- The deal already cash-flows at list — no discount required.
- Meets the 1% rule at list price ($3k rent vs $98k).
- Recommended offer: $86k (12.0% below list) — sets the bar for market timing.
- Cap rate 25.3% vs local median 2.6% in Orcutt — top-decile yield for the area; either an underpriced asset or a hidden risk that comps aren't pricing in. Stress-test before assuming the spread holds.
Location & tenants
- Location reads 73/100 on livability (#169 in CA) — a middle-class / working-renter tenant base. Strengths: commute A+, employment A+, housing A+; Watch: crime D+, cost of living F.
- Orcutt Union Elementary (suburban): math 44% / reading 54% proficiency, ranked #414 of 1,400 in CA (top 30%) — families likely to look elsewhere, expect single-tenant / working-renter base with shorter leases.
- Zoned schools: Alice Shaw Elementary (511 students, 53% FRL); Lakeview Junior High (442 students, 46% FRL); Ernest Righetti High (2,494 students, 64% FRL) — zoned schools average 54% FRL vs 30% district-wide (24 pts higher); higher-poverty schools than district average — tighter screening recommended.
- Market conditions: Rents rising (+2.2%/yr); 121 active listings in the ZIP; 2 comparable units currently listed for rent nearby; high-income renter base; 719 units permitted in Santa Barbara County in 2024 (217 in 5+ unit buildings).
- This rent runs 34% of the median local income ($111k/yr) — at the standard rent-burdened threshold; future hikes will face affordability resistance.
Forward outlook
- Local home prices are declining (-3.0%/yr); year-one equity from $678 of loan paydown is wiped out by about $3k of value loss. Plan a longer hold.
- Santa Barbara County population projected at +20% by 2050 — long-run rental-demand tailwind backs the buy-and-hold thesis.
- At projected returns (-3.0% appreciation + 2.2% rent growth), your $27k cash investment doubles in ~2 years — after that, you're playing with house money.
Negotiation context
- It's been on market 272 days — a 12% lower offer ($86k) is reasonable based on typical stale-listing flexibility.
- 4 sale attempts since 29y ago with the ask held roughly flat each time — persistent listings suggest the price (not the market) is what's stuck; bring a comps-based counter.
Questions for the listing agent
- It's been on market 272 days. Have you received any prior offers? Is the seller open to a 12% concession, seller financing, or rate buy-down credit?
- What does the HOA fee cover, when was the last increase, and are there any pending special assessments or reserve-fund shortfalls?
- Why hasn't it sold? Are there any deal-killer items the seller is aware of (foundation, flood, title, zoning, code violations)?
- Is there a deadline driving the sale (1031 exchange, divorce, estate, relocation)? That informs how much negotiation room exists.
- Schools are B-rated — typically a magnet for longer-tenancy family renters. What's the average tenant stay here, and is there a school-zone premium baked into asking?
- Crime grade is D in this area — have there been break-ins, vandalism, or insurance claims at this property in the last 3 years? What carrier currently insures it and at what premium?
- What's the average days-on-market for RENTAL listings here right now (not sales)? A rising rental-DOM trend means longer vacancies and softer asking-rent achievability than the comps imply.
- What's the recent tenant-quality profile in this submarket — average credit score on applications, eviction rate, late-payment / NSF rate, and stable-employment percentage? A property-management company in the area should have these aggregated.
- How much new for-sale + rental construction is in the pipeline within 1–3 miles? Heavy new supply typically softens prices + rents 12–24 months out; constrained supply supports both.
Investment metrics
- 1% rule
- 3.20% ✓
- Cap rate
- 25.29%
- Cash-on-cash
- 67.84%
- DSCR
- 4.02
- GRM
- 2.6
CMA / ARV
- ARV (on-the-fly)
- $411,840
- Comps found
- 12
Show comp detail 12 sales within ~0.75 mi
| Address | Dist | Beds/Ba | Sqft | Sold | Price | $/sf | Match |
|---|---|---|---|---|---|---|---|
| 1111 Devonshire | 0.35mi | 2/2.0 | 1,536 (-3%) | 6mo | $410,000 | $267 | 74 |
| 4026 Berwyn Dr | 0.33mi | 2/2.0 | 1,536 (-3%) | 10mo | $390,000 | $254 | 72 |
| 995 N White Dove Dr #137 | 0.49mi | 3/2.0 (+1) | 1,536 (-3%) | 2mo | $324,000 | $211 | 65 |
| 1126 Sunnyslope Ln | 0.30mi | 2/2.0 | 1,728 (+9%) | 9mo | $449,000 | $260 | 63 |
| 3362 Turtle Crk | 0.63mi | 3/2.0 (+1) | 1,536 (-3%) | 0mo | $545,000 | $355 | 60 |
| 3449 Quail Mdws | 0.51mi | 2/2.0 | 1,440 (-9%) | 4mo | $295,000 | $205 | 58 |
| 954 Bluejay Dr | 0.73mi | 2/2.0 | 1,532 (-3%) | 3mo | $165,000 | $108 | 58 |
| 967 S White Dove Dr | 0.46mi | 3/2.0 (+1) | 1,440 (-9%) | 5mo | $350,000 | $243 | 54 |
| 3301 Turtle Creek Dr | 0.69mi | 3/2.0 (+1) | 1,440 (-9%) | 3mo | $575,000 | $399 | 45 |
| 804 Covey Ln | 0.70mi | 3/2.0 (+1) | 1,440 (-9%) | 4mo | $545,000 | $378 | 43 |
| 977 S Ridge Vw | 0.67mi | 3/2.0 (+1) | 1,440 (-9%) | 6mo | $340,000 | $236 | 43 |
| 881 Greenacre | 0.74mi | 3/2.0 (+1) | 1,440 (-9%) | 5mo | $590,000 | $410 | 41 |
Match score weights: distance 35% · size 25% · config 20% · recency 20%. Top-matched comps best support the ARV.
Projected returns pro-forma
-3.0% appreciation · 2.23% rent growth · sell at horizon
- IRR
- 66.3%
- Equity multiple
- 3.94×
- Total profit
- $80,712
- Equity at exit
- $14,612
- IRR
- 70.3%
- Equity multiple
- 7.87×
- Total profit
- $188,578
- Equity at exit
- $8,473
Cash invested: $27,440 (down + closing). Projections, not guarantees.
Landlord ↔ Tenant lean methodology
- Overall (STATE)
- 18 Strongly Tenant-Friendly
- State California
- 18 Strongly Tenant-Friendly · D+13
- County
- — inherits STATE
- City
- — inherits STATE
ZIP-level market 93455
- Rents YoY
- 2.2%
- Active inventory
- 121
- Price-to-rent
- 2.6×
Monthly cashflow live
- Estimated rent
- $3,137 medium interval (Pro) →
- Mortgage (P&I)
- −$514
- Tax est. 1.5%
- −$122 /mo · $1,470/yr
- Insurance
- −$41
- HOA
- −$250
- Vacancy / Maint / Mgmt
- −$659
- Net cashflow
- $1,551
Break-even live
Sensitivity live
| Price | -10% $1,619 | -5% $1,585 | +0% $1,551 | +5% $1,517 | +10% $1,484 |
|---|---|---|---|---|---|
| Rent | -10% $1,303 | -5% $1,427 | +0% $1,551 | +5% $1,675 | +10% $1,799 |
| Rate | -1.0pp $1,601 | -0.5pp $1,576 | base $1,551 | +0.5pp $1,526 | +1.0pp $1,500 |
UW: 25.0% down · 7.5% · 30yr · 1.5% tax · 5.0% vac · 8.0% maint · 8.0% mgmt
Financing live
Cash to close
- Down payment
- $24,500
- Closing costs
- $2,940
- Reserves months
- —
- Total cash needed
- —
Loan-product check · same deal, 3 products live
Conventional
25% down · 7.5% · 30yr
- Down + closing
- —
- Monthly P&I
- —
- Monthly cashflow
- —
- DSCR
- —
- Eligible?
- —
Personal DTI + credit; lowest rate.
DSCR
20% down · 8.5% · 30yr
- Down + closing
- —
- Monthly P&I
- —
- Monthly cashflow
- —
- DSCR
- —
- Eligible?
- —
No personal income docs; deal must DSCR.
Hard money
10% down · 12.0% · 12mo
- Down + closing
- —
- Monthly P&I
- —
- Monthly cashflow
- —
- DSCR
- —
- Eligible?
- —
Short-term bridge; refi at stabilization.
Rent comps 2 comps
| Address | Beds | Baths | Sqft | Rent | $/sqft | DOM | Units | Dist |
|---|---|---|---|---|---|---|---|---|
| 1462 Woodmere Rd Santa Maria, CA | 3.0 | 2.0 | 1440 | $3,800 | $2.64 | 16d | 1 | 1.08mi |
| 3235 Orcutt Rd Orcutt, CA | 2.0–3.0 | 2.0 | 1202 | $2,695 | $2.24 | 16d | 5 | 1.31mi |
HOA detail
- Monthly dues
- $250 · $3,000/yr
Listing history 24 events
-
2026-06-21days on market $98,000 Active 272 DOM
-
2026-06-18days on market $98,000 Active 269 DOM
-
2026-06-17days on market $98,000 Active 268 DOM
-
2026-06-16days on market $98,000 Active 267 DOM
-
2026-06-15days on market $98,000 Active 266 DOM
-
2026-06-14days on market $98,000 Active 264 DOM
-
2026-06-13days on market $98,000 Active 263 DOM
-
2026-06-10days on market $98,000 Active 261 DOM
-
2026-06-09days on market $98,000 Active 260 DOM
-
2026-06-08days on market $98,000 Active 259 DOM
-
2026-06-07days on market $98,000 Active 258 DOM
-
2026-06-05days on market $98,000 Active 255 DOM
-
2026-06-03days on market $98,000 Active 254 DOM
-
2026-06-02days on market $98,000 Active 253 DOM
-
2026-06-01days on market $98,000 Active 252 DOM
-
2026-05-31days on market $98,000 Active 251 DOM
-
2026-05-30days on market $98,000 Active 250 DOM
-
2025-09-22$98,000 Active
-
2016-10-21soldstatus $100,000 341-char remark
Show marketing remark (341 chars)
Fabulous Triplewide Home With Real Hardwood Floors! Bright Cheery Interior, Large Master Suite, Great Modern Kitchen With Room For Kitchen Table, Indoor Laundry, Wet Bar, Fireplace, Stained Glass, Secluded Backyard, All Appliances Included. Add Your Personal Touches And Call The Movers! Land May Be Purchased Thereby Eliminating Space Rent.
-
2016-09-09$99,900 341-char remark
Show marketing remark (341 chars)
Fabulous Triplewide Home With Real Hardwood Floors! Bright Cheery Interior, Large Master Suite, Great Modern Kitchen With Room For Kitchen Table, Indoor Laundry, Wet Bar, Fireplace, Stained Glass, Secluded Backyard, All Appliances Included. Add Your Personal Touches And Call The Movers! Land May Be Purchased Thereby Eliminating Space Rent.
-
2016-09-06historical
-
2016-07-14$99,000
-
1998-08-14soldstatus $59,900
-
1997-07-16$59,999
ⓘ Source: listings_history table (triggers on properties + properties_extension) + one-shot
backfill from property_details.listing_events for pre-trigger history.
Climate risk First Street
- Flood 1/10 Low FEMA zone X (unshaded) · 0% chance over 30 yrs
- Wildfire 4/10 Moderate
- Heat 3/10 Moderate 7 d/yr ≥87°F today · 16 d/yr by 30 yrs out
- Wind 1/10 Low
- Air quality 6/10 Major 8 unhealthy d/yr today · 10 by 30 yrs out
Nearby sold comps map
Loading sold comps map…
Walkable amenities ~0.75 mi
Loading nearby amenities…
Taxation est. · year 1
- Rental income
- $37,649
- − Mortgage interest
- −$5,490
- − Property taxes
- −$1,470
- − Insurance
- −$490
- − Repairs & maintenance
- −$3,012
- − Management
- −$3,012
- − HOA
- −$3,000
- − Depreciation
- −$2,851
- Taxable income
- $18,325
- Est. tax owed @ 24.0%
- −$4,398
- After-tax cash flow
- $14,218/yr
For passive investors: Depreciation is non-cash, so a rental often shows a tax loss while cash-flowing — sheltering income. Rental losses are passive: they offset passive income freely, and up to $25,000/yr can offset ordinary (W-2) income if you actively participate and your MAGI is under $100k (phasing out to $0 by $150k); unused losses carry forward. On sale, claimed depreciation is recaptured at up to 25%, and gains may owe capital-gains tax (a 1031 exchange can defer both). Figures are a year-1 estimate at your 24.0% rate — not tax advice; consult a CPA.
Schools (NCES district)
- District
- Orcutt Union Elementary
- NCES district ID
- 0628710
- Math proficiency
- 44% ▼ -1.00%
- Reading proficiency
- 54% ▲ 2.00%
- Median HH income
- $70,564
- Composite
- 45.96/100
- National rank
- #5530
- State rank
- #414 of 1400 in CA
Livability — Orcutt
- Score
- 73/100
- State rank
- #169
- US rank
- #5508
Category grades
Schools grade is shown separately in the Schools card above.
Census & demographics
- Census place
- Orcutt, CA
- County
- Santa Barbara County · 410,380 people
- Metro
- Santa Maria-Santa Barbara, CA
- Population (ZIP)
- 44,611
- Household income
- $110,661
- Rent vs Own
- Severe rent burden
- 765.0
Population outlook (Santa Barbara County) Hauer SSP2
- Today (2025)
- 484,679 people
- By 2030
- 505,323 · +4.3%
- By 2040
- 545,783 · +12.6%
- By 2050
- 584,263 · +20.5%
- By 2075
- 682,586 · +40.8%
- By 2100
- 723,188 · +49.2%
Race, ethnicity, and origin ACS 2023
- Neighborhood character
- Diverse neighborhood (Simpson 0.61)
- Race & ethnicity
- White 47% Hispanic / Latino 41% Two or more races 24% Asian 5% Black 2%
- Hispanic origin (detail)
- Mexican 38%
- Common ancestry
- Lithuanian 2% Russian 2% Italian 2%
- Foreign-born
- 13% · Canada, China, South Korea
- Languages at home
- 73% English-only · Spanish 23% Tagalog/Filipino 2%
Political lean MEDSL · Santa Barbara
- 2024 margin
- Strong D (+26.7) · D 61.8% · R 35.1% · Other 3.1%
- 2008→2024 swing
- +3.8pp toward D · 2008: 22.9pp · 2024: 26.7pp
- All cycles
- 2024: D+26.7 2020: D+32.1 2016: D+28.2 2012: D+17.1 2008: D+22.9
Not yet ingested
- Civics
- —
Market trends
- HPI YoY
- ▼ -729.78%
- Current HPI
- 314.6499
- Rent YoY
- ▲ 2.23%
- Metro
- Santa Maria-Santa Barbara, CA
- State GDP YoY
- ▲ 3.21%
- F500 in state
- 116
Industry mix (Fortune 500 HQ in CA)
| Industry | F500 HQs | Revenue |
|---|---|---|
| Technology | 27 | $1,492B |
|
||
| Financial Services | 3 | $174B |
|
||
| Retail | 3 | $44B |
|
||
| Insurance | 3 | $26B |
|
||
| Media / Entertainment | 2 | $115B |
|
||
| Pharmaceuticals / Biotech | 2 | $62B |
|
||
Price history
+63.3% since first listed7 events — show timeline
- 2025-09-22 Listed $98,000 NSBCRMLS
- 2016-10-21 Sold (MLS) $100,000 NSBCRMLS
- 2016-09-09 Listed $99,900 NSBCRMLS
- 2016-09-06 Listing Removed — NSBCRMLS
- 2016-07-14 Listed $99,000 NSBCRMLS
- 1998-08-14 Sold (MLS) $59,900 NSBCRMLS
- 1997-07-16 Listed $59,999 NSBCRMLS
Property tax history
-5.2%/yrLatest (2025): $179 · +2.6% YoY. Source: county tax records.
Cash-flow waterfall
monthlySold comps — $/sqft
last 12 mo · ≤1 miLoading sold comps…