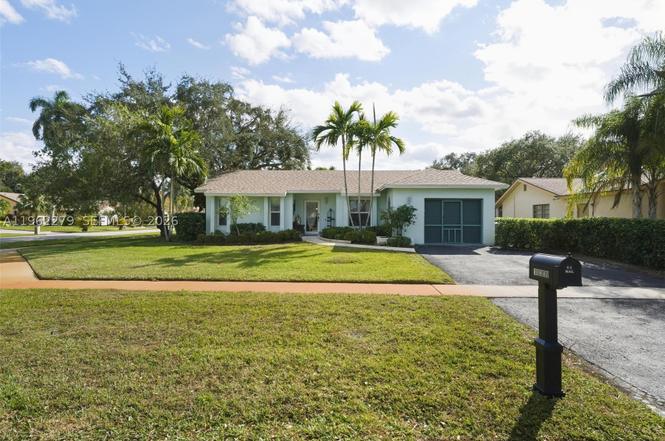
10308 Greenbriar Ct
Boca Raton, FL 33498
$480,000D
2 bd · 2.0 ba ·
1,580 sqft ·
Built 1980
· SingleFamily
· Active
· 129 DOM
Cashflow @ list (25.0% down · 7.5%)
Estimated rent
$3,912/mo
Mortgage (P&I)
−$2,517
Tax + insurance
−$720
HOA
−$218
Vac / Maint / Mgmt
−$821
Net cashflow
$-365/mo
Annual
$-4,377/yr
Cap rate
5.38%
Cash-on-cash
-3.26%
DSCR
0.86
1% rule
0.81%
Cash to close
$134,400
Investor read
- This is a 2-bed/2.0-bath single-family listed at $480k.
- At list price, monthly cash flow is $-365 ($-4k/yr) — negative.
- To cash-flow at today's rent, offer at most $416k (13.4% below list).
- To meet the 1% rule (rent ≥ 1% of price), the offer needs to be $391k (18.5% below list).
- It's been on market 129 days — a 12% lower offer ($422k) is reasonable based on typical stale-listing flexibility.
- Recommended offer: $391k (18.5% below list) — sets the bar for 1% rule.
- In year one you build about $26k of equity ($3k loan paydown + $22k appreciation (4.7% local appreciation)).
- Location reads 77/100 on livability (#192 in FL, #3,070 nationally) — a middle-class / working-renter tenant base. Strengths: schools A+, employment A+, health & safety A+; Watch: amenities D, cost of living F.
- Palm Beach (suburban): math 46% / reading 53% proficiency, ranked #34 of 73 in FL (top 47%) — families likely to look elsewhere, expect single-tenant / working-renter base with shorter leases.
- Market conditions: 92 active listings in the ZIP; 30 comparable units currently listed for rent nearby; rentals at typical pace (median 21d on market — plan ~3-4 weeks tenant-placement turnaround); high-income renter base; 3,974 units permitted in Palm Beach County in 2024 (1,012 in 5+ unit buildings).
- Palm Beach County population projected at +30% by 2050 — long-run rental-demand tailwind backs the buy-and-hold thesis.
- 2 sale attempts since 3y ago; this cycle's ask has dropped $40k (8%) from the opening price — seller is motivated, your offer sets the floor, not the list.
- By year 2, paydown + projected appreciation supports a ~$41k cash-out refi (75% LTV) — recoverable capital for the next deal without selling this one.
- Climate carrying-cost: severe wind risk, 99% chance of damaging wind over 30y; moderate wildfire risk; extreme-heat days projected 6→20/yr by 2055 (HVAC capex compounding) — expect insurance premiums to compound above CPI over the hold.
- Cap rate 5.4% vs local median 2.8% in Boca Raton — top-decile yield for the area; either an underpriced asset or a hidden risk that comps aren't pricing in. Stress-test before assuming the spread holds.
- This rent runs 32% of the median local income ($147k/yr) — at the standard rent-burdened threshold; future hikes will face affordability resistance.
Questions for listing agent
- What do current leases actually rent for vs. the listed asking? Can we see a recent rent roll and the last 12 months of T-12 income?
- It's been on market 129 days. Have you received any prior offers? Is the seller open to a 19% concession, seller financing, or rate buy-down credit?
- What does the HOA fee cover, when was the last increase, and are there any pending special assessments or reserve-fund shortfalls?
- Why hasn't it sold? Are there any deal-killer items the seller is aware of (foundation, flood, title, zoning, code violations)?
- Is there a deadline driving the sale (1031 exchange, divorce, estate, relocation)? That informs how much negotiation room exists.
- Schools are A-rated — typically a magnet for longer-tenancy family renters. What's the average tenant stay here, and is there a school-zone premium baked into asking?
- The area grade is low — what's the realistic commute time and amenity access for the typical tenant pool here? Any planned neighborhood developments (good or bad) we should know about?
- What's the average days-on-market for RENTAL listings here right now (not sales)? A rising rental-DOM trend means longer vacancies and softer asking-rent achievability than the comps imply.
CashFlowRE · CFR-Z9XNTJ0QZCS929
· Data 2 days ago
cashflowre.app · 2026-05-29