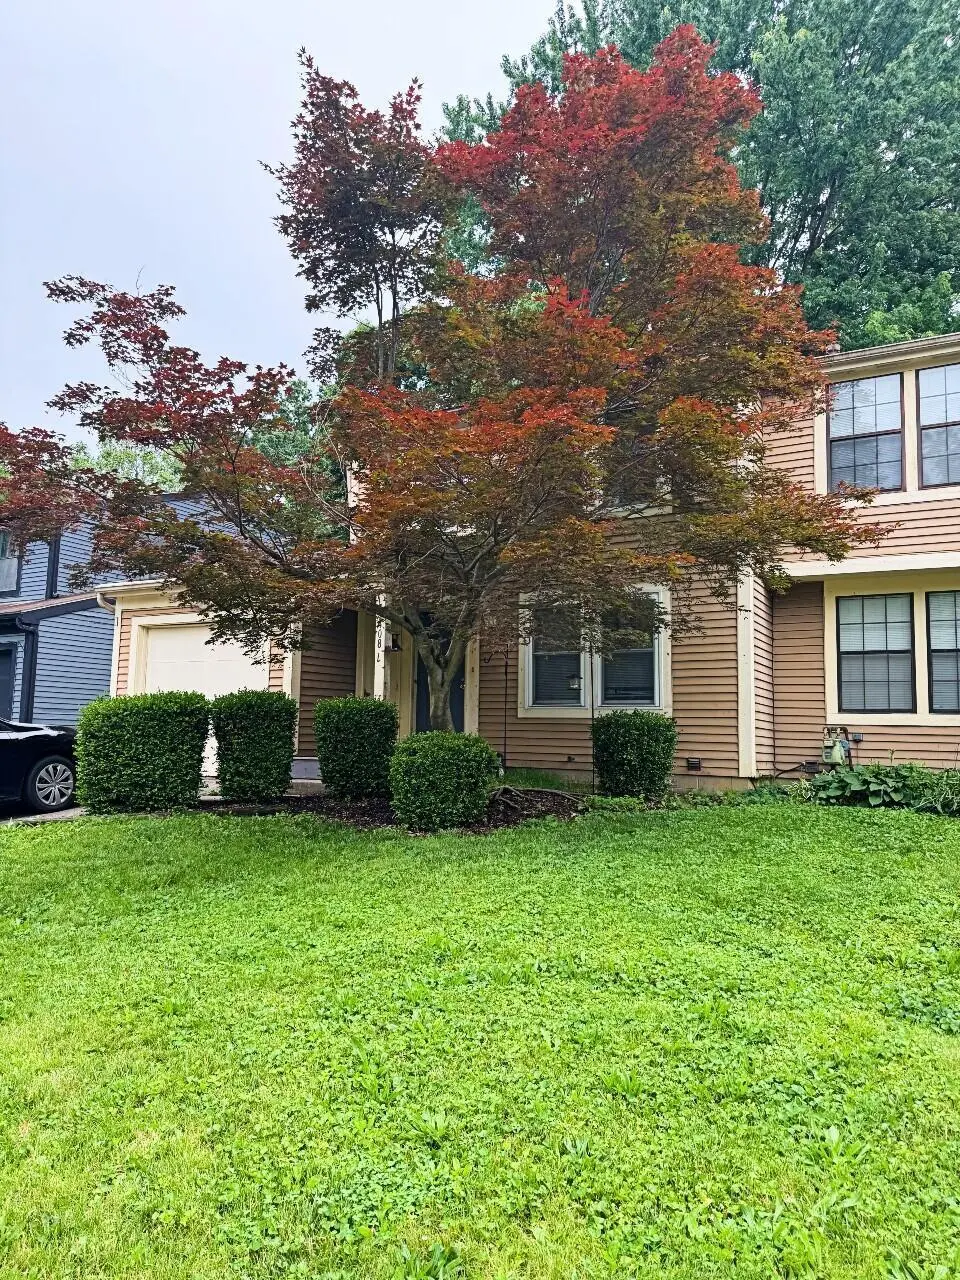
4087 Forest Edge Dr
Columbus, OH 43230
$179,900B
3 bd · 1.5 ba ·
1,204 sqft ·
Built 1983
· MultiFamily
· Active
· 2 DOM
Cashflow @ list (25.0% down · 7.5%)
Estimated rent
$3,363/mo
Mortgage (P&I)
−$943
Tax + insurance
−$304
HOA
−$0
Vac / Maint / Mgmt
−$706
Net cashflow
$1,409/mo
Annual
$16,911/yr
Cap rate
15.69%
Cash-on-cash
33.57%
DSCR
2.49
1% rule
1.87%
Cash to close
$50,372
Investor read
- This is a 3-bed/1.5-bath multifamily listed at $180k.
- At list price, monthly cash flow is $1k ($17k/yr) — positive.
- The deal already cash-flows at list — no discount required.
- Meets the 1% rule at list price ($3k rent vs $180k).
- Only 2 days on market — expect competitive offers; lowballing is unlikely to land.
- Local home prices are declining (-3.0%/yr); year-one equity from $1k of loan paydown is wiped out by about $5k of value loss. Plan a longer hold.
- Location reads 81/100 on livability (#97 in OH, #1,491 nationally) — a professional / high-income tenant draw. Strengths: commute A+, cost of living A+, housing A+; Watch: employment C-, crime F.
- Westerville City (suburban): math 54% / reading 63% proficiency, ranked #276 of 656 in OH (top 42%) — acceptable for families but not a draw, mixed tenant base, ~2y average lease.
- Zoned schools: Hawthorne Elementary School (math 53% / reading 58%, grade C, #772 of 1,584 statewide, top 49%, 543 students, 59% FRL); Heritage Middle School (math 48% / reading 55%, grade C, #401 of 654 statewide, top 62%, 858 students, 48% FRL); Westerville-North High School (math 34% / reading 64%, grade D, #422 of 781 statewide, top 54%, 1,524 students, 28% FRL) — zoned schools average 45% FRL vs 27% district-wide (18 pts higher); higher-poverty schools than district average — tighter screening recommended.
- Market conditions: Rents rising (+3.9%/yr); 103 active listings in the ZIP; 21 comparable units currently listed for rent nearby; rentals at typical pace (median 17d on market — plan ~3-4 weeks tenant-placement turnaround); solid renter incomes; 8,139 units permitted in Franklin County in 2024 (5,940 in 5+ unit buildings).
- Franklin County population projected at +34% by 2050 — long-run rental-demand tailwind backs the buy-and-hold thesis.
- Current owner paid $82k; list at $180k implies a 119% gain — meaningful room to come down on a strong offer.
- At projected returns (-3.0% appreciation + 3.9% rent growth), your $50k cash investment doubles in ~4 years — after that, you're playing with house money.
- Cap rate 15.7% vs local median 3.8% in Columbus — top-decile yield for the area; either an underpriced asset or a hidden risk that comps aren't pricing in. Stress-test before assuming the spread holds.
- This rent runs 44% of the median local income ($91k/yr) — at the standard rent-burdened threshold; future hikes will face affordability resistance.
Questions for listing agent
- Is there a deadline driving the sale (1031 exchange, divorce, estate, relocation)? That informs how much negotiation room exists.
- Crime grade is F in this area — have there been break-ins, vandalism, or insurance claims at this property in the last 3 years? What carrier currently insures it and at what premium?
- What's the average days-on-market for RENTAL listings here right now (not sales)? A rising rental-DOM trend means longer vacancies and softer asking-rent achievability than the comps imply.
- What's the recent tenant-quality profile in this submarket — average credit score on applications, eviction rate, late-payment / NSF rate, and stable-employment percentage? A property-management company in the area should have these aggregated.
- How much new apartment / multifamily construction is in the pipeline within 1–3 miles? Heavy new supply (>2% of stock underway) typically softens rents 12–24 months out; light construction supports rent growth.
CashFlowRE · CFR-ZAZTC20WWAGB6R
· Data 2 weeks ago
cashflowre.app · 2026-05-29