 Multi-family
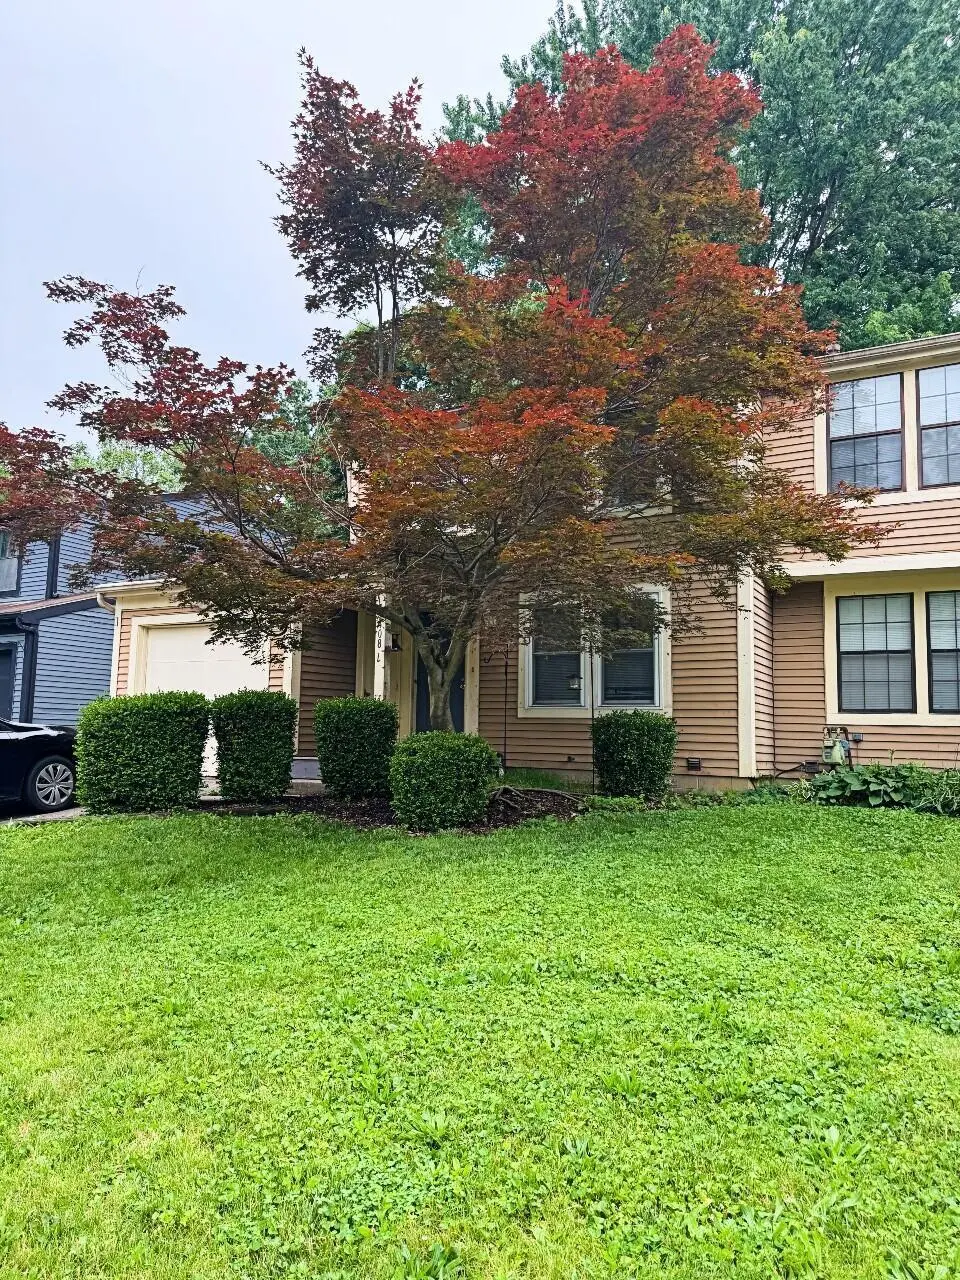
4087 Forest Edge Dr · Columbus, OH
Flood risk 1/10 · Minimal
- FEMA flood zone
- X (unshaded)
- Chance of flooding over 30 yrs
- 0.0%
- Est. flood insurance / yr
- $473 – $860
Fire risk 1/10 · Minimal
- Est. fire insurance / yr
- $713 – $1,323
Heat risk 3/10 · Minor
- Hot days now (above 100°F)
- 7 days/yr
- Hot days in 30 yrs
- 18 days/yr
Wind risk 2/10 · Minimal
- Chance of severe wind over 30 yrs
- 0.0%
Air-quality risk 3/10 · Minor
- Unhealthy air days now
- 2 days/yr
- Unhealthy air days in 30 yrs
- 4 days/yr
Risk factors via First Street. Map © Google.
Why this score? — see what drove the B grade
The composite is a weighted blend of 9 inputs, each scored 0–100. Each bar is that input's sub-score; the figure is the points it added to the 100-point composite (weight × sub-score).
- Cash flow +30.0/30.0
- 1% rule +10.0/10.0
- DSCR +10.0/10.0
- ARV discount +7.5/15.0
- Schools +5.2/10.0
- Livability +4.0/5.0
- Rent growth +3.5/5.0
- Condition / age +2.5/5.0
- Appreciation +0.0/10.0
$179,900
🖨 Deal sheet (PDF) 📄 Offer letter ✓ Due diligence
Multi-family units
County records classify this as Multi-Family (2-4 Unit). Listing-text estimate: 1 unit. estimate disagrees with records
Listing remarks MLS
WONDERFUL TWO-STORY TWIN SINGLE LOCATED IN THE BEAUTIFUL STRAWBERRY FARMSAREA. UPDATED WINDOWS-FINISHED BASEMENT, NEUTRAL COLORS. NICE OLDER GROWTHPARTLY WOODED LOT. SETTING IN A QUIET NEIGHBORHOOD. THIS MUST SEE, WON'TBE AROUND LONG!
Key facts
- 4,356 sq ft lot
- Garage
- Built 1983
Property features AI
Exterior
- Parking: Attached garage (1 garage space); On-street parking
- Utilities: Public water; Public sewer
- Home design: Single-family residence (duplex structure); Three levels; Built in 1983; One common wall
- Construction: Block foundation
- Exterior features: Deck; Fenced yard
Interior
- Flooring: Carpet; Vinyl
- Bathrooms: 1 full bathroom; 1 half bathroom (total 1.5 bathrooms)
- Interior features: Full basement; Living area approximately 1,204
Neighborhood map
What this means for you Summary
Snapshot
- This is a 3-bed/1.5-bath multifamily listed at $180k.
Deal economics
- At list price, monthly cash flow is $1k ($17k/yr) — positive.
- The deal already cash-flows at list — no discount required.
- Meets the 1% rule at list price ($3k rent vs $180k).
- Cap rate 15.7% vs local median 3.8% in Columbus — top-decile yield for the area; either an underpriced asset or a hidden risk that comps aren't pricing in. Stress-test before assuming the spread holds.
Location & tenants
- Location reads 81/100 on livability (#97 in OH, #1,491 nationally) — a professional / high-income tenant draw. Strengths: commute A+, cost of living A+, housing A+; Watch: employment C-, crime F.
- Westerville City (suburban): math 54% / reading 63% proficiency, ranked #276 of 656 in OH (top 42%) — acceptable for families but not a draw, mixed tenant base, ~2y average lease.
- Zoned schools: Hawthorne Elementary School (math 53% / reading 58%, grade C, #772 of 1,584 statewide, top 49%, 543 students, 59% FRL); Heritage Middle School (math 48% / reading 55%, grade C, #401 of 654 statewide, top 62%, 858 students, 48% FRL); Westerville-North High School (math 34% / reading 64%, grade D, #422 of 781 statewide, top 54%, 1,524 students, 28% FRL) — zoned schools average 45% FRL vs 27% district-wide (18 pts higher); higher-poverty schools than district average — tighter screening recommended.
- Market conditions: Rents rising (+3.9%/yr); 103 active listings in the ZIP; 21 comparable units currently listed for rent nearby; rentals at typical pace (median 16d on market — plan ~3-4 weeks tenant-placement turnaround); solid renter incomes; 8,139 units permitted in Franklin County in 2024 (5,940 in 5+ unit buildings).
- This rent runs 44% of the median local income ($91k/yr) — at the standard rent-burdened threshold; future hikes will face affordability resistance.
Forward outlook
- Local home prices are declining (-3.0%/yr); year-one equity from $1k of loan paydown is wiped out by about $5k of value loss. Plan a longer hold.
- Franklin County population projected at +34% by 2050 — long-run rental-demand tailwind backs the buy-and-hold thesis.
- At projected returns (-3.0% appreciation + 3.9% rent growth), your $50k cash investment doubles in ~4 years — after that, you're playing with house money.
Negotiation context
- Only 2 days on market — expect competitive offers; lowballing is unlikely to land.
- Current owner paid $82k; list at $180k implies a 119% gain — meaningful room to come down on a strong offer.
Questions for the listing agent
- Is there a deadline driving the sale (1031 exchange, divorce, estate, relocation)? That informs how much negotiation room exists.
- Crime grade is F in this area — have there been break-ins, vandalism, or insurance claims at this property in the last 3 years? What carrier currently insures it and at what premium?
- What's the average days-on-market for RENTAL listings here right now (not sales)? A rising rental-DOM trend means longer vacancies and softer asking-rent achievability than the comps imply.
- What's the recent tenant-quality profile in this submarket — average credit score on applications, eviction rate, late-payment / NSF rate, and stable-employment percentage? A property-management company in the area should have these aggregated.
- How much new apartment / multifamily construction is in the pipeline within 1–3 miles? Heavy new supply (>2% of stock underway) typically softens rents 12–24 months out; light construction supports rent growth.
Investment metrics
- 1% rule
- 1.87% ✓
- Cap rate
- 15.69%
- Cash-on-cash
- 33.57%
- DSCR
- 2.49
- GRM
- 4.5
CMA / ARV
No comps found within radius.
Projected returns pro-forma
-3.0% appreciation · 3.89% rent growth · sell at horizon
- IRR
- 29.9%
- Equity multiple
- 2.26×
- Total profit
- $63,698
- Equity at exit
- $26,824
- IRR
- 37.7%
- Equity multiple
- 4.65×
- Total profit
- $183,956
- Equity at exit
- $15,554
Cash invested: $50,372 (down + closing). Projections, not guarantees.
Landlord ↔ Tenant lean methodology
- Overall (STATE)
- 73 Landlord-Friendly
- State Ohio
- 73 Landlord-Friendly · R+6
- County
- — inherits STATE
- City
- — inherits STATE
ZIP-level market 43230
- Rents YoY
- 3.9%
- Active inventory
- 103
- Price-to-rent
- 8.9×
Monthly cashflow live
- Estimated rent
- $3,363 high interval (Pro) →
- Mortgage (P&I)
- −$943
- Tax from tax record
- −$229 /mo · $2,749/yr
- Insurance
- −$75
- HOA
- −$0
- Vacancy / Maint / Mgmt
- −$706
- Net cashflow
- $1,409
Break-even live
Sensitivity live
| Price | -10% $1,511 | -5% $1,460 | +0% $1,409 | +5% $1,358 | +10% $1,307 |
|---|---|---|---|---|---|
| Rent | -10% $1,144 | -5% $1,276 | +0% $1,409 | +5% $1,542 | +10% $1,675 |
| Rate | -1.0pp $1,500 | -0.5pp $1,455 | base $1,409 | +0.5pp $1,363 | +1.0pp $1,315 |
2-unit breakdown (identical units grouped — click to expand)
| Units | Beds | Baths | Est. rent |
|---|---|---|---|
| 2× units | 3 | 1.5 | $3,364 |
| #1 | 3 | 1.5 | $1,682 |
| #2 | 3 | 1.5 | $1,682 |
| Total (2 units) | $3,363 | ||
UW: 25.0% down · 7.5% · 30yr · 1.5% tax · 5.0% vac · 8.0% maint · 8.0% mgmt
Financing live
Cash to close
- Down payment
- $44,975
- Closing costs
- $5,397
- Reserves months
- —
- Total cash needed
- —
Loan-product check · same deal, 3 products live
Conventional
25% down · 7.5% · 30yr
- Down + closing
- —
- Monthly P&I
- —
- Monthly cashflow
- —
- DSCR
- —
- Eligible?
- —
Personal DTI + credit; lowest rate.
DSCR
20% down · 8.5% · 30yr
- Down + closing
- —
- Monthly P&I
- —
- Monthly cashflow
- —
- DSCR
- —
- Eligible?
- —
No personal income docs; deal must DSCR.
Hard money
10% down · 12.0% · 12mo
- Down + closing
- —
- Monthly P&I
- —
- Monthly cashflow
- —
- DSCR
- —
- Eligible?
- —
Short-term bridge; refi at stabilization.
Rent comps 21 comps
| Address | Beds | Baths | Sqft | Rent | $/sqft | DOM | Units | Dist |
|---|---|---|---|---|---|---|---|---|
| 5398 Rockingham Ct Westerville, OH | 2.0 | 1.0 | 1100 | $1,400 | $1.27 | 12d | 5 | 0.28mi |
| 5390 Harbin Pl Unit 5452 Westerville, OH | 2.0 | 1.0 | 900 | $900 | $1.00 | 25d | 1 | 0.31mi |
| 5390 Harbin Pl Unit 5438 Westerville, OH | 2.0 | 1.0 | 900 | $900 | $1.00 | 14d | 1 | 0.31mi |
| 5424 Rockingham Ct Unit RO 5424 Westerville, OH | 2.0 | 1.0 | 1100 | $1,400 | $1.27 | 14d | 1 | 0.31mi |
| 5422 Woodvale Ct Unit WD 5422 Westerville, OH | 2.0 | 1.0 | 1100 | $1,500 | $1.36 | 18d | 1 | 0.32mi |
| 5429 Harbin Ct Unit HA 5429 Westerville, OH | 2.0 | 1.0 | 1100 | $1,300 | $1.18 | 18d | 1 | 0.33mi |
| 5473 W Woodvale Ct Unit WDW 5473 Westerville, OH | 2.0 | 1.0 | 1100 | $1,550 | $1.41 | 18d | 1 | 0.37mi |
| 3692 N Woodvale Ct Unit Wdn Westerville, OH | 2.0 | 1.0 | 1100 | $1,500 | $1.36 | 16d | 1 | 0.40mi |
| 5500 Hildebrand Rd Columbus, OH | 1.0–3.0 | 1.0–2.0 | 917 | $1,890 | $2.06 | 45d | 1 | 0.71mi |
| 4600 Sunbury Springs Pkwy Columbus, OH | 1.0–2.0 | 1.0–2.0 | 819 | $1,520 | $1.86 | 45d | 1 | 0.83mi |
| 3830 Hampton Woods Dr Columbus, OH | 2.0 | 1.0 | 576 | $1,000 | $1.74 | 45d | 1 | 0.93mi |
| 5050 Westerville Rd Columbus, OH | 1.0–2.0 | 1.0–2.0 | 1230 | $1,965 | $1.60 | 3d | 12 | 0.95mi |
| 5695 Cherry Bottom Rd Columbus, OH | 1.0–2.0 | 1.0–2.0 | 819 | $1,509 | $1.84 | 3d | 11 | 1.05mi |
| 3311 Kristin Ct Unit 3311 Columbus, OH | 3.0 | 1.5 | 1100 | $1,450 | $1.32 | 45d | 1 | 1.06mi |
| 5415 Turtle Sta Westerville, OH | 2.0–3.0 | 2.0–2.5 | 1600 | $2,425 | $1.52 | 3d | 33 | 1.15mi |
| 4150 Silver Springs Ln Columbus, OH | 1.0–3.0 | 1.0–2.5 | 1104 | $2,270 | $2.06 | 3d | 46 | 1.19mi |
| 4934 Allwood Dr Columbus, OH | 3.0 | 2.0 | 1207 | $2,505 | $2.08 | 5d | 1 | 1.20mi |
| 3553 Triton Ct Westerville, OH | 3.0 | 2.0 | 1188 | $2,600 | $2.19 | 45d | 1 | 1.23mi |
| 3553 Triton Ct Westerville, OH | 3.0 | 2.0 | 1200 | $2,600 | $2.17 | 3d | 1 | 1.23mi |
| 4483 Wingfield St Columbus, OH | 3.0 | 2.0 | 1310 | $2,500 | $1.91 | 45d | 1 | 1.38mi |
| 942 S Spring Rd Westerville, OH | 2.0 | 1.5 | 1100 | $1,295 | $1.18 | 3d | 1 | 1.48mi |
Listing history 11 events
-
2026-06-07statusdays on market $179,900 Active 2 DOM
-
2026-06-03days on market $179,900 Coming Soon 7 DOM
-
2026-06-02days on market $179,900 Coming Soon 6 DOM
-
2026-06-01days on market $179,900 Coming Soon 5 DOM
-
2026-05-31days on market $179,900 Coming Soon 4 DOM
-
2026-05-28historical $179,900
-
1999-09-02soldstatus $82,000
-
1999-08-31soldstatus $82,000 234-char remark
Show marketing remark (234 chars)
WONDERFUL TWO-STORY TWIN SINGLE LOCATED IN THE BEAUTIFUL STRAWBERRY FARMSAREA. UPDATED WINDOWS-FINISHED BASEMENT, NEUTRAL COLORS. NICE OLDER GROWTHPARTLY WOODED LOT. SETTING IN A QUIET NEIGHBORHOOD. THIS MUST SEE, WON'TBE AROUND LONG!
-
1999-08-15historical 234-char remark
Show marketing remark (234 chars)
WONDERFUL TWO-STORY TWIN SINGLE LOCATED IN THE BEAUTIFUL STRAWBERRY FARMSAREA. UPDATED WINDOWS-FINISHED BASEMENT, NEUTRAL COLORS. NICE OLDER GROWTHPARTLY WOODED LOT. SETTING IN A QUIET NEIGHBORHOOD. THIS MUST SEE, WON'TBE AROUND LONG!
-
1999-06-23$84,000 234-char remark
Show marketing remark (234 chars)
WONDERFUL TWO-STORY TWIN SINGLE LOCATED IN THE BEAUTIFUL STRAWBERRY FARMSAREA. UPDATED WINDOWS-FINISHED BASEMENT, NEUTRAL COLORS. NICE OLDER GROWTHPARTLY WOODED LOT. SETTING IN A QUIET NEIGHBORHOOD. THIS MUST SEE, WON'TBE AROUND LONG!
-
1984-02-01soldstatus $57,400
ⓘ Source: listings_history table (triggers on properties + properties_extension) + one-shot
backfill from property_details.listing_events for pre-trigger history.
Tax reassessment forecast OH · Partial reset (capped growth)
- Current annual tax
- $2,749 · $229/mo
- Projected year-2 tax
- $2,778 · $231/mo
- Expected delta
- +$29/yr (+$2/mo · 1.0%)
ⓘ Screening estimate from a state-policy table — verify with the county assessor before closing.
Climate risk First Street
- Flood 1/10 Low FEMA zone X (unshaded) · 0% chance over 30 yrs
- Wildfire 1/10 Low
- Heat 3/10 Moderate 7 d/yr ≥100°F today · 18 d/yr by 30 yrs out
- Wind 2/10 Low 0% chance of damaging wind over 30 yrs
- Air quality 3/10 Moderate 2 unhealthy d/yr today · 4 by 30 yrs out
Nearby sold comps map
Loading sold comps map…
Walkable amenities ~0.75 mi
Loading nearby amenities…
Taxation est. · year 1
- Rental income
- $40,356
- − Mortgage interest
- −$10,077
- − Property taxes
- −$2,749
- − Insurance
- −$900
- − Repairs & maintenance
- −$3,228
- − Management
- −$3,228
- − Depreciation
- −$5,233
- Taxable income
- $14,940
- Est. tax owed @ 24.0%
- −$3,585
- After-tax cash flow
- $13,326/yr
For passive investors: Depreciation is non-cash, so a rental often shows a tax loss while cash-flowing — sheltering income. Rental losses are passive: they offset passive income freely, and up to $25,000/yr can offset ordinary (W-2) income if you actively participate and your MAGI is under $100k (phasing out to $0 by $150k); unused losses carry forward. On sale, claimed depreciation is recaptured at up to 25%, and gains may owe capital-gains tax (a 1031 exchange can defer both). Figures are a year-1 estimate at your 24.0% rate — not tax advice; consult a CPA.
Schools (NCES district)
- District
- Westerville City
- NCES district ID
- 3904504
- Math proficiency
- 54% ▼ -16.00%
- Reading proficiency
- 63% ▼ -6.00%
- Median HH income
- $72,017
- Composite
- 51.9/100
- National rank
- #1649
- State rank
- #276 of 656 in OH
Livability — Columbus
- Score
- 81/100
- State rank
- #97
- US rank
- #1491
Category grades
Schools grade is shown separately in the Schools card above.
Census & demographics
- Census place
- Columbus, OH
- County
- Franklin County · 1,351,780 people
- City population
- 612,189
- Metro
- Columbus, OH
- Population (ZIP)
- 58,076
- Household income
- $91,424
- Rent vs Own
- Severe rent burden
- 1879.0
Population outlook (Franklin County) Hauer SSP2
- Today (2025)
- 1,456,139 people
- By 2030
- 1,556,890 · +6.9%
- By 2040
- 1,757,349 · +20.7%
- By 2050
- 1,950,539 · +34.0%
- By 2075
- 2,376,171 · +63.2%
- By 2100
- 2,636,796 · +81.1%
Race, ethnicity, and origin ACS 2023
- Neighborhood character
- Majority White (64%)
- Race & ethnicity
- White 64% Black 19% Two or more races 6% Asian 5% Hispanic / Latino 5%
- Common ancestry
- Romanian 3% Italian 3% Lithuanian 2%
- Foreign-born
- 10% · Canada, China, Vietnam
- Languages at home
- 89% English-only · Spanish 3% Other Indo-European 2% French/Haitian/Cajun 1%
Political lean MEDSL · Franklin
- 2024 margin
- Strong D (+28.4) · D 63.7% · R 35.3% · Other 1.0%
- 2008→2024 swing
- +7.7pp toward D · 2008: 20.7pp · 2024: 28.4pp
- All cycles
- 2024: D+28.4 2020: D+31.4 2016: D+25.9 2012: D+21.7 2008: D+20.7
Not yet ingested
- Civics
- —
Market trends
- HPI YoY
- ▼ -254.58%
- Current HPI
- 257.0667
- Rent YoY
- ▲ 3.89%
- Metro
- Columbus, OH
- State GDP YoY
- ▲ 1.98%
- F500 in state
- 48
Industry mix (Fortune 500 HQ in OH)
| Industry | F500 HQs | Revenue |
|---|---|---|
| Insurance | 3 | $145B |
|
||
| Industrial Machinery | 3 | $49B |
|
||
| Financial Services | 3 | $24B |
|
||
| Consumer Goods | 2 | $93B |
|
||
| Aerospace / Defense | 2 | $47B |
|
||
| Utilities | 2 | $33B |
|
||
Price history
+213.4% since first listed6 events — show timeline
- 2026-05-28 Coming Soon $179,900 CBRMLS
- 1999-09-02 Sold (Public Records) $82,000 Public Records
- 1999-08-31 Sold (MLS) $82,000 CBRMLS
- 1999-08-15 Listing Removed — CBRMLS
- 1999-06-23 Listed $84,000 CBRMLS
- 1984-02-01 Sold (Public Records) $57,400 Public Records
Property tax history
+3.4%/yrLatest (2024): $2,749 · +2.5% YoY. Source: county tax records.
Cash-flow waterfall
monthlySold comps — $/sqft
last 12 mo · ≤1 miLoading sold comps…