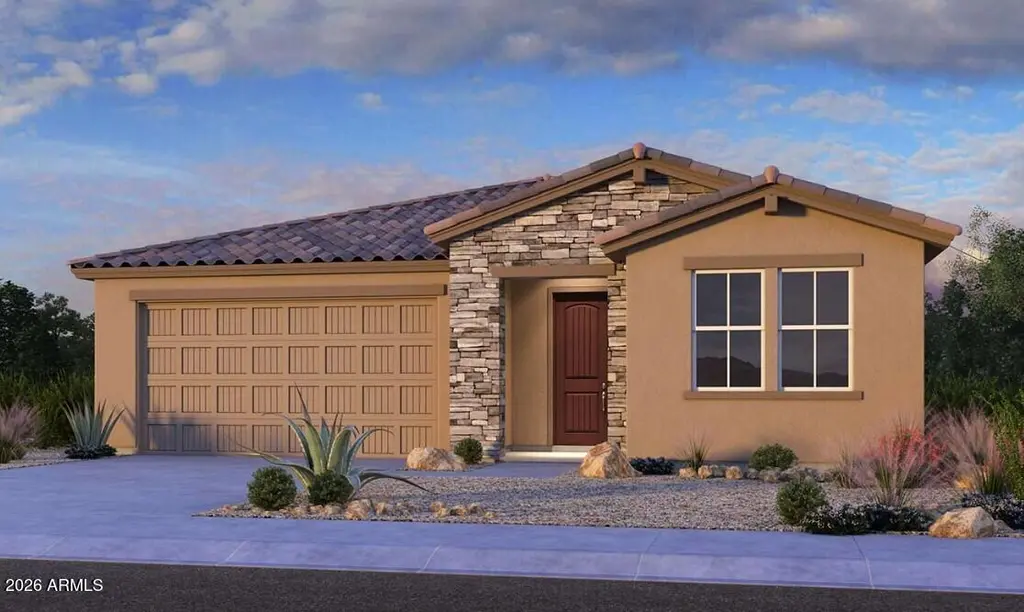
17065 W Hope Dr
Surprise, AZ 85388
$519,990F
4 bd · 3.0 ba ·
2,352 sqft ·
Built 2026
· Land
· Active
· 89 DOM
Cashflow @ list (25.0% down · 7.5%)
Estimated rent
$2,639/mo
Mortgage (P&I)
−$2,727
Tax + insurance
−$867
HOA
−$161
Vac / Maint / Mgmt
−$554
Net cashflow
$-1,670/mo
Annual
$-20,037/yr
Cap rate
2.44%
Cash-on-cash
-13.76%
DSCR
0.39
1% rule
0.51%
Cash to close
$145,597
Investor read
- This is a 4-bed/3.0-bath land listed at $520k.
- At list price, monthly cash flow is $-2k ($-20k/yr) — negative.
- To cash-flow at today's rent, offer at most $278k (46.5% below list).
- To meet the 1% rule (rent ≥ 1% of price), the offer needs to be $264k (49.2% below list).
- It's been on market 89 days — a 6% lower offer ($489k) is reasonable based on typical stale-listing flexibility.
- Recommended offer: $264k (49.2% below list) — sets the bar for 1% rule.
- In year one you build about $5k of equity ($4k loan paydown + $1k appreciation (0.3% local appreciation)).
- Location reads 74/100 on livability (#19 in AZ, #4,616 nationally) — a middle-class / working-renter tenant base. Strengths: crime A+, housing A+, employment A-; Watch: health & safety D+, amenities D-, commute F.
- Dysart Unified District (4243) (suburban): math 34% / reading 40% proficiency, ranked #73 of 249 in AZ (top 29%) — families likely to look elsewhere, expect single-tenant / working-renter base with shorter leases.
- Zoned schools: Sonoran Heights Middle School (math 46% / reading 48%, grade D+, #40 of 218 statewide, top 19%, 712 students, 35% FRL); Shadow Ridge High School (math 34% / reading 39%, grade F, #88 of 381 statewide, top 24%, 2,323 students, 21% FRL).
- Market conditions: Rents soft (-0.6%/yr); 389 active listings in the ZIP; 25 comparable units currently listed for rent nearby; rentals at typical pace (median 20d on market — plan ~3-4 weeks tenant-placement turnaround); high-income renter base; 36,011 units permitted in Maricopa County in 2024 (12,801 in 5+ unit buildings).
- Maricopa County population projected at +38% by 2050 — long-run rental-demand tailwind backs the buy-and-hold thesis.
- 2 sale attempts with the ask held roughly flat each time — persistent listings suggest the price (not the market) is what's stuck; bring a comps-based counter.
- By year 6, paydown + projected appreciation supports a ~$33k cash-out refi (75% LTV) — recoverable capital for the next deal without selling this one.
- Cap rate 2.4% vs local median 3.3% in Surprise — below-typical yield; the buyer is paying a premium for something (appreciation thesis, condition, location) that the cap rate doesn't capture.
Questions for listing agent
- What do current leases actually rent for vs. the listed asking? Can we see a recent rent roll and the last 12 months of T-12 income?
- It's been on market 89 days. Have you received any prior offers? Is the seller open to a 49% concession, seller financing, or rate buy-down credit?
- What does the HOA fee cover, when was the last increase, and are there any pending special assessments or reserve-fund shortfalls?
- Why hasn't it sold? Are there any deal-killer items the seller is aware of (foundation, flood, title, zoning, code violations)?
- Is there a deadline driving the sale (1031 exchange, divorce, estate, relocation)? That informs how much negotiation room exists.
- The area grade is low — what's the realistic commute time and amenity access for the typical tenant pool here? Any planned neighborhood developments (good or bad) we should know about?
- What's the average days-on-market for RENTAL listings here right now (not sales)? A rising rental-DOM trend means longer vacancies and softer asking-rent achievability than the comps imply.
- What's the recent tenant-quality profile in this submarket — average credit score on applications, eviction rate, late-payment / NSF rate, and stable-employment percentage? A property-management company in the area should have these aggregated.
CashFlowRE · CFR-ZBHQCBBZ3SK9FB
· Data 1 day ago
cashflowre.app · 2026-05-29