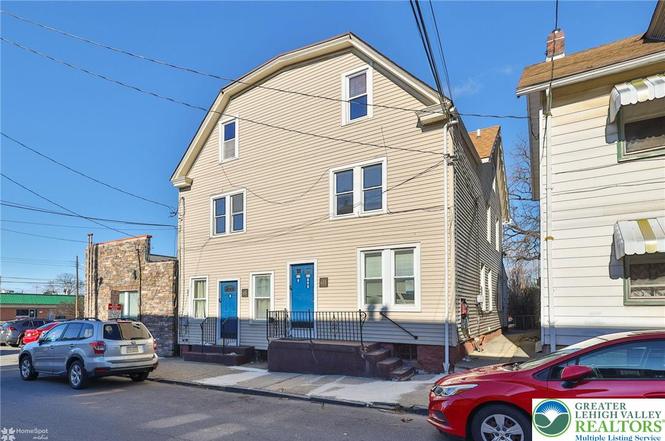
633 Berwick St
Easton, PA 18042
$695,000B
35 bd · 25.0 ba ·
3,174 sqft ·
Built 1900
· MultiFamily
· Pending
· 88 DOM
Cashflow @ list (25.0% down · 7.5%)
Estimated rent
$10,473/mo
Mortgage (P&I)
−$3,645
Tax + insurance
−$711
HOA
−$0
Vac / Maint / Mgmt
−$2,199
Net cashflow
$3,918/mo
Annual
$47,014/yr
Cap rate
13.06%
Cash-on-cash
24.16%
DSCR
2.07
1% rule
1.51%
Cash to close
$194,600
Investor read
- This is a 5 × 7-bed/5.0-bath units multifamily listed at $695k.
- At list price, monthly cash flow is $4k ($47k/yr) — positive. Per door: $784/mo.
- The deal already cash-flows at list — no discount required.
- Meets the 1% rule at list price ($10k rent vs $695k).
- It's been on market 88 days — a 6% lower offer ($653k) is reasonable based on typical stale-listing flexibility.
- Recommended offer: $653k (6.0% below list) — sets the bar for market timing.
- Local home prices are declining (-3.0%/yr); year-one equity from $5k of loan paydown is wiped out by about $21k of value loss. Plan a longer hold.
- Location reads 84/100 on livability (#92 in PA, #667 nationally) — a professional / high-income tenant draw. Strengths: amenities A+, cost of living A+, housing A+; Watch: schools C-.
- Easton Area SD (suburban): math 31% / reading 44% proficiency, ranked #364 of 539 in PA (top 68%) — families likely to look elsewhere, expect single-tenant / working-renter base with shorter leases.
- Watch-outs: built in 1900 — expect roof / HVAC / electrical / plumbing capex.
- Market conditions: Rents rising fast (+4.9%/yr); 185 active listings in the ZIP; solid renter incomes; 567 units permitted in Northampton County in 2024 (151 in 5+ unit buildings).
- 6 sale attempts since 11y ago with the ask held roughly flat each time — persistent listings suggest the price (not the market) is what's stuck; bring a comps-based counter.
- Current owner paid $464k; 50% above their basis — modest negotiation headroom, anchor on the comps not their cost.
- At projected returns (-3.0% appreciation + 4.9% rent growth), your $195k cash investment doubles in ~5 years — after that, you're playing with house money.
- Climate carrying-cost: extreme-heat days projected 7→16/yr by 2055 (HVAC capex compounding) — expect insurance premiums to compound above CPI over the hold.
- Cap rate 13.1% vs local median 4.2% in Easton — top-decile yield for the area; either an underpriced asset or a hidden risk that comps aren't pricing in. Stress-test before assuming the spread holds.
- At $10,473/mo this rent would consume 162% of the median local household income ($78k/yr) (locally 1590% of renters already pay >50% of income on rent) — very limited rent-growth headroom before tenants either downsize or default.
Questions for listing agent
- It's been on market 88 days. Have you received any prior offers? Is the seller open to a 6% concession, seller financing, or rate buy-down credit?
- Can we see the unit-by-unit rent roll, current vacancy, and any below-market leases? What's the average tenancy length?
- What capital expenditures (roof, boiler, parking lot, exteriors) have been made in the last 5 years, and what's planned in the next 2?
- Built in 1900 — when were the roof, HVAC, electrical panel, plumbing, and water heater last replaced?
- Why hasn't it sold? Are there any deal-killer items the seller is aware of (foundation, flood, title, zoning, code violations)?
- Is there a deadline driving the sale (1031 exchange, divorce, estate, relocation)? That informs how much negotiation room exists.
- What's the average days-on-market for RENTAL listings here right now (not sales)? A rising rental-DOM trend means longer vacancies and softer asking-rent achievability than the comps imply.
- What's the recent tenant-quality profile in this submarket — average credit score on applications, eviction rate, late-payment / NSF rate, and stable-employment percentage? A property-management company in the area should have these aggregated.
CashFlowRE · CFR-ZCBPP8FHF8QDX1
· Data 3 weeks ago
cashflowre.app · 2026-05-29