 5-Plex
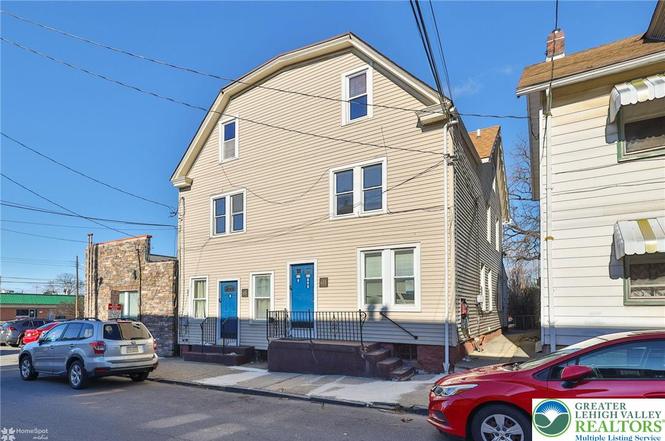
633 Berwick St · Easton, PA
Flood risk 1/10 · Minimal
- FEMA flood zone
- X (unshaded)
- Chance of flooding over 30 yrs
- 0.0%
- Est. flood insurance / yr
- $473 – $860
Fire risk 3/10 · Minor
- Est. fire insurance / yr
- $511 – $949
Heat risk 5/10 · Moderate
- Hot days now (above 100°F)
- 7 days/yr
- Hot days in 30 yrs
- 16 days/yr
Wind risk 4/10 · Minor
- Chance of severe wind over 30 yrs
- 15.0%
Air-quality risk 3/10 · Minor
- Unhealthy air days now
- 3 days/yr
- Unhealthy air days in 30 yrs
- 5 days/yr
Risk factors via First Street. Map © Google.
Why this score? — see what drove the B grade
The composite is a weighted blend of 9 inputs, each scored 0–100. Each bar is that input's sub-score; the figure is the points it added to the 100-point composite (weight × sub-score).
- Cash flow +30.0/30.0
- 1% rule +10.0/10.0
- DSCR +10.0/10.0
- ARV discount +7.5/15.0
- Livability +4.2/5.0
- Rent growth +3.7/5.0
- Schools +3.3/10.0
- Condition / age +2.5/5.0
- Appreciation +0.0/10.0
$695,000
🖨 Deal sheet 📄 Offer letter ✓ Due diligence
Multi-family units
County records classify this as Multi-Family (5+ Unit). Listing-text estimate: 5 units. confirmed
5+ unit building — per-unit beds/baths from public records are typically unavailable; the breakdown below (if shown) is an estimate from the listing text.
Listing remarks MLS
Multiple offers received. Highest and Best Offers by 2/25/21 at 12pm, noon! Get your offer in NOW on this Cash-flowing 5 unit with 5 car parking in Easton! This multi-unit has longstanding, paying tenants and can be a lucrative addition to your portfolio. Some units still have value-add opportunity. NEW fire system - 5 boilers with gas heat, separate meters, separate thermostats- 5 water meters (not separated water- but can be separated and water billed to tenants. ) Landlord pays water/sewer/trash. Tenants pay electric, gas stove, gas heat. BNI report will be provided to the buyer. Multiple Units for sale - call for details.
Key facts
- 3,920 sq ft lot
- 5 parking spots
- Built 1900
Tags
Neighborhood map
What this means for you Summary
Snapshot
- This is a 5 × 7-bed/5.0-bath units multifamily listed at $695k.
Deal economics
- At list price, monthly cash flow is $4k ($47k/yr) — positive. Per door: $784/mo.
- The deal already cash-flows at list — no discount required.
- Meets the 1% rule at list price ($10k rent vs $695k).
- Recommended offer: $653k (6.0% below list) — sets the bar for market timing.
- Cap rate 13.1% vs local median 4.2% in Easton — top-decile yield for the area; either an underpriced asset or a hidden risk that comps aren't pricing in. Stress-test before assuming the spread holds.
Location & tenants
- Location reads 84/100 on livability (#92 in PA, #667 nationally) — a professional / high-income tenant draw. Strengths: amenities A+, cost of living A+, housing A+; Watch: schools C-.
- Easton Area SD (suburban): math 31% / reading 44% proficiency, ranked #364 of 539 in PA (top 68%) — families likely to look elsewhere, expect single-tenant / working-renter base with shorter leases.
- Market conditions: Rents rising fast (+4.9%/yr); 185 active listings in the ZIP; solid renter incomes; 567 units permitted in Northampton County in 2024 (151 in 5+ unit buildings).
- At $10,473/mo this rent would consume 162% of the median local household income ($78k/yr) (locally 1590% of renters already pay >50% of income on rent) — very limited rent-growth headroom before tenants either downsize or default.
Forward outlook
- Local home prices are declining (-3.0%/yr); year-one equity from $5k of loan paydown is wiped out by about $21k of value loss. Plan a longer hold.
- At projected returns (-3.0% appreciation + 4.9% rent growth), your $195k cash investment doubles in ~5 years — after that, you're playing with house money.
Negotiation context
- It's been on market 88 days — a 6% lower offer ($653k) is reasonable based on typical stale-listing flexibility.
- 6 sale attempts since 11y ago with the ask held roughly flat each time — persistent listings suggest the price (not the market) is what's stuck; bring a comps-based counter.
- Current owner paid $464k; 50% above their basis — modest negotiation headroom, anchor on the comps not their cost.
Risks & watch-outs
- Watch-outs: built in 1900 — expect roof / HVAC / electrical / plumbing capex.
- Climate carrying-cost: extreme-heat days projected 7→16/yr by 2055 (HVAC capex compounding) — expect insurance premiums to compound above CPI over the hold.
Questions for the listing agent
- It's been on market 88 days. Have you received any prior offers? Is the seller open to a 6% concession, seller financing, or rate buy-down credit?
- Can we see the unit-by-unit rent roll, current vacancy, and any below-market leases? What's the average tenancy length?
- What capital expenditures (roof, boiler, parking lot, exteriors) have been made in the last 5 years, and what's planned in the next 2?
- Built in 1900 — when were the roof, HVAC, electrical panel, plumbing, and water heater last replaced?
- Why hasn't it sold? Are there any deal-killer items the seller is aware of (foundation, flood, title, zoning, code violations)?
- Is there a deadline driving the sale (1031 exchange, divorce, estate, relocation)? That informs how much negotiation room exists.
- What's the average days-on-market for RENTAL listings here right now (not sales)? A rising rental-DOM trend means longer vacancies and softer asking-rent achievability than the comps imply.
- What's the recent tenant-quality profile in this submarket — average credit score on applications, eviction rate, late-payment / NSF rate, and stable-employment percentage? A property-management company in the area should have these aggregated.
- How much new apartment / multifamily construction is in the pipeline within 1–3 miles? Heavy new supply (>2% of stock underway) typically softens rents 12–24 months out; light construction supports rent growth.
Investment metrics
- 1% rule
- 1.51% ✓
- Cap rate
- 13.06%
- Cash-on-cash
- 24.16%
- DSCR
- 2.07
- GRM
- 5.5
CMA / ARV
No comps found within radius.
Projected returns pro-forma
-3.0% appreciation · 4.94% rent growth · sell at horizon
- IRR
- 19.5%
- Equity multiple
- 1.81×
- Total profit
- $157,628
- Equity at exit
- $103,627
- IRR
- 29.0%
- Equity multiple
- 3.81×
- Total profit
- $547,059
- Equity at exit
- $60,091
Cash invested: $194,600 (down + closing). Projections, not guarantees.
Landlord ↔ Tenant lean methodology
- Overall (STATE)
- 62 Landlord-Friendly
- State Pennsylvania
- 62 Landlord-Friendly · EVEN
- County
- — inherits STATE
- City
- — inherits STATE
ZIP-level market 18042
- Rents YoY
- 4.9%
- Active inventory
- 185
- Price-to-rent
- 27.7×
Monthly cashflow live
- Estimated rent
- $10,473 medium interval (Pro) →
- Mortgage (P&I)
- −$3,645
- Tax from tax record
- −$422 /mo · $5,059/yr
- Insurance
- −$290
- HOA
- −$0
- Vacancy / Maint / Mgmt
- −$2,199
- Net cashflow
- $3,918
Break-even live
5-unit breakdown (identical units grouped — click to expand)
| Units | Beds | Baths | Est. rent |
|---|---|---|---|
| 5× units | 7 | 5 | $10,475 |
| #1 | 7 | 5 | $2,095 |
| #2 | 7 | 5 | $2,095 |
| #3 | 7 | 5 | $2,095 |
| #4 | 7 | 5 | $2,095 |
| #5 | 7 | 5 | $2,095 |
| Total (5 units) | $10,473 | ||
UW: 25.0% down · 7.5% · 30yr · 1.5% tax · 5.0% vac · 8.0% maint · 8.0% mgmt
Financing live
Cash to close
- Down payment
- $173,750
- Closing costs
- $20,850
- Reserves months
- —
- Total cash needed
- —
Loan-product check · same deal, 3 products live
Conventional
25% down · 7.5% · 30yr
- Down + closing
- —
- Monthly P&I
- —
- Monthly cashflow
- —
- DSCR
- —
- Eligible?
- —
Personal DTI + credit; lowest rate.
DSCR
20% down · 8.5% · 30yr
- Down + closing
- —
- Monthly P&I
- —
- Monthly cashflow
- —
- DSCR
- —
- Eligible?
- —
No personal income docs; deal must DSCR.
Hard money
10% down · 12.0% · 12mo
- Down + closing
- —
- Monthly P&I
- —
- Monthly cashflow
- —
- DSCR
- —
- Eligible?
- —
Short-term bridge; refi at stabilization.
Listing history 20 events
-
2026-04-19status Pending
-
2026-01-21$695,000 Active
-
2025-02-20historical $1,250
-
2025-01-24price $1,250
-
2025-01-09$1,350
-
2021-04-16soldstatus $464,000 Sold 634-char remark
Show marketing remark (634 chars)
Multiple offers received. Highest and Best Offers by 2/25/21 at 12pm, noon! Get your offer in NOW on this Cash-flowing 5 unit with 5 car parking in Easton! This multi-unit has longstanding, paying tenants and can be a lucrative addition to your portfolio. Some units still have value-add opportunity. NEW fire system - 5 boilers with gas heat, separate meters, separate thermostats- 5 water meters (not separated water- but can be separated and water billed to tenants. ) Landlord pays water/sewer/trash. Tenants pay electric, gas stove, gas heat. BNI report will be provided to the buyer. Multiple Units for sale - call for details.
-
2021-04-16soldstatus $464,000 634-char remark
Show marketing remark (634 chars)
Multiple offers received. Highest and Best Offers by 2/25/21 at 12pm, noon! Get your offer in NOW on this Cash-flowing 5 unit with 5 car parking in Easton! This multi-unit has longstanding, paying tenants and can be a lucrative addition to your portfolio. Some units still have value-add opportunity. NEW fire system - 5 boilers with gas heat, separate meters, separate thermostats- 5 water meters (not separated water- but can be separated and water billed to tenants. ) Landlord pays water/sewer/trash. Tenants pay electric, gas stove, gas heat. BNI report will be provided to the buyer. Multiple Units for sale - call for details.
-
2021-03-02status Pending 634-char remark
Show marketing remark (634 chars)
Multiple offers received. Highest and Best Offers by 2/25/21 at 12pm, noon! Get your offer in NOW on this Cash-flowing 5 unit with 5 car parking in Easton! This multi-unit has longstanding, paying tenants and can be a lucrative addition to your portfolio. Some units still have value-add opportunity. NEW fire system - 5 boilers with gas heat, separate meters, separate thermostats- 5 water meters (not separated water- but can be separated and water billed to tenants. ) Landlord pays water/sewer/trash. Tenants pay electric, gas stove, gas heat. BNI report will be provided to the buyer. Multiple Units for sale - call for details.
-
2021-02-20$439,700 634-char remark
Show marketing remark (634 chars)
Multiple offers received. Highest and Best Offers by 2/25/21 at 12pm, noon! Get your offer in NOW on this Cash-flowing 5 unit with 5 car parking in Easton! This multi-unit has longstanding, paying tenants and can be a lucrative addition to your portfolio. Some units still have value-add opportunity. NEW fire system - 5 boilers with gas heat, separate meters, separate thermostats- 5 water meters (not separated water- but can be separated and water billed to tenants. ) Landlord pays water/sewer/trash. Tenants pay electric, gas stove, gas heat. BNI report will be provided to the buyer. Multiple Units for sale - call for details.
-
2021-02-18$439,700 Active 634-char remark
Show marketing remark (634 chars)
Multiple offers received. Highest and Best Offers by 2/25/21 at 12pm, noon! Get your offer in NOW on this Cash-flowing 5 unit with 5 car parking in Easton! This multi-unit has longstanding, paying tenants and can be a lucrative addition to your portfolio. Some units still have value-add opportunity. NEW fire system - 5 boilers with gas heat, separate meters, separate thermostats- 5 water meters (not separated water- but can be separated and water billed to tenants. ) Landlord pays water/sewer/trash. Tenants pay electric, gas stove, gas heat. BNI report will be provided to the buyer. Multiple Units for sale - call for details.
-
2016-10-31soldstatus $175,900
-
2016-10-28soldstatus $175,900 Sold
-
2016-08-04status Pending
-
2016-04-11$219,900 Active
-
2015-10-31historical
-
2015-08-04price $250,000
-
2015-05-01$299,900 Active
-
2006-01-31soldstatus $132,275
-
1986-12-01soldstatus $67,000
-
1986-07-01soldstatus $32,000
ⓘ Source: listings_history table (triggers on properties + properties_extension) + one-shot
backfill from property_details.listing_events for pre-trigger history.
Tax reassessment forecast PA · Partial reset (capped growth)
- Current annual tax
- $5,059 · $422/mo
- Projected year-2 tax
- $8,020 · $668/mo
- Expected delta
- +$2,961/yr (+$247/mo · 58.5%)
ⓘ Screening estimate from a state-policy table — verify with the county assessor before closing.
Climate risk First Street
- Flood 1/10 Low FEMA zone X (unshaded) · 0% chance over 30 yrs
- Wildfire 3/10 Moderate
- Heat 5/10 Major 7 d/yr ≥100°F today · 16 d/yr by 30 yrs out
- Wind 4/10 Moderate 15% chance of damaging wind over 30 yrs
- Air quality 3/10 Moderate 3 unhealthy d/yr today · 5 by 30 yrs out
Nearby sold comps map
Loading sold comps map…
Walkable amenities ~0.75 mi
Loading nearby amenities…
Taxation est. · year 1
- Rental income
- $125,676
- − Mortgage interest
- −$38,931
- − Property taxes
- −$5,059
- − Insurance
- −$3,475
- − Repairs & maintenance
- −$10,054
- − Management
- −$10,054
- − Depreciation
- −$20,218
- Taxable income
- $37,884
- Est. tax owed @ 24.0%
- −$9,092
- After-tax cash flow
- $37,921/yr
For passive investors: Depreciation is non-cash, so a rental often shows a tax loss while cash-flowing — sheltering income. Rental losses are passive: they offset passive income freely, and up to $25,000/yr can offset ordinary (W-2) income if you actively participate and your MAGI is under $100k (phasing out to $0 by $150k); unused losses carry forward. On sale, claimed depreciation is recaptured at up to 25%, and gains may owe capital-gains tax (a 1031 exchange can defer both). Figures are a year-1 estimate at your 24.0% rate — not tax advice; consult a CPA.
Schools (NCES district)
- District
- Easton Area SD
- NCES district ID
- 4208850
- Math proficiency
- 31% ▼ -2.00%
- Reading proficiency
- 44% ▼ -11.00%
- Median HH income
- $61,390
- Composite
- 33.46/100
- National rank
- #5457
- State rank
- #364 of 539 in PA
Livability — Easton
- Score
- 84/100
- State rank
- #92
- US rank
- #667
Category grades
Schools grade is shown separately in the Schools card above.
Census & demographics
- Census place
- Easton, PA
- County
- Northampton County · 236,814 people
- City population
- 75,961
- Metro
- Allentown-Bethlehem-Easton, PA-NJ
- Population (ZIP)
- 45,532
- Household income
- $77,556
- Rent vs Own
- Severe rent burden
- 1590.0
Population outlook (Northampton County) Hauer SSP2
- Today (2025)
- 312,227 people
- By 2030
- 314,769 · +0.8%
- By 2040
- 316,914 · +1.5%
- By 2050
- 318,037 · +1.9%
- By 2075
- 334,003 · +7.0%
- By 2100
- 344,696 · +10.4%
Race, ethnicity, and origin ACS 2023
- Neighborhood character
- Diverse neighborhood (Simpson 0.61)
- Race & ethnicity
- White 57% Hispanic / Latino 21% Black 12% Two or more races 12% Asian 3%
- Hispanic origin (detail)
- Mexican 3% Puerto Rican 7% Dominican 3%
- Common ancestry
- Romanian 3% Polish 2% Iranian 1%
- Foreign-born
- 13% · Canada, China, Jamaica
- Languages at home
- 80% English-only · Spanish 15% Other Indo-European 1% Arabic 1%
Political lean MEDSL · Northampton
- 2024 margin
- Toss-up / Even · D 48.6% · R 50.4%
- 2008→2024 swing
- -14.1pp toward R · 2008: 12.3pp · 2024: -1.8pp
- All cycles
- 2024: R+1.8 2020: D+0.7 2016: R+3.8 2012: D+4.6 2008: D+12.3
Not yet ingested
- Civics
- —
Market trends
- HPI YoY
- ▼ -460.52%
- Current HPI
- 254.8776
- Rent YoY
- ▲ 4.94%
- Metro
- Allentown-Bethlehem-Easton, PA-NJ
- State GDP YoY
- ▲ 1.68%
- F500 in state
- 34
Industry mix (Fortune 500 HQ in PA)
| Industry | F500 HQs | Revenue |
|---|---|---|
| Healthcare | 2 | $309B |
|
||
| Insurance | 2 | $27B |
|
||
| Telecommunications / Media | 1 | $124B |
|
||
| Industrial Distribution | 1 | $22B |
|
||
| Financial Services | 1 | $20B |
|
||
| Chemicals / Materials | 1 | $18B |
|
||
Price history
+2071.9% since first listed20 events — show timeline
- 2026-04-19 Pending — GLVRMLS
- 2026-01-21 Listed $695,000 GLVRMLS
- 2025-02-20 Rental Removed $1,250 GLVRMLS
- 2025-01-24 Price Changed $1,250 GLVRMLS
- 2025-01-09 Listed for Rent $1,350 GLVRMLS
- 2021-04-16 Sold (MLS) $464,000 PMAR
- 2021-04-16 Sold (MLS) $464,000 GLVRMLS
- 2021-03-02 Pending — GLVRMLS
- 2021-02-20 Listed $439,700 PMAR
- 2021-02-18 Listed $439,700 GLVRMLS
- 2016-10-31 Sold (Public Records) $175,900 Public Records
- 2016-10-28 Sold (MLS) $175,900 GLVRMLS
- 2016-08-04 Pending — GLVRMLS
- 2016-04-11 Listed $219,900 GLVRMLS
- 2015-10-31 Listing Removed — GLVRMLS
- 2015-08-04 Price Changed $250,000 GLVRMLS
- 2015-05-01 Listed $299,900 GLVRMLS
- 2006-01-31 Sold (Public Records) $132,275 Public Records
- 1986-12-01 Sold (Public Records) $67,000 Public Records
- 1986-07-01 Sold (Public Records) $32,000 Public Records
Property tax history
+1.3%/yrLatest (2026): $5,059 · +2.3% YoY. Source: county tax records.
Cash-flow waterfall
monthlySold comps — $/sqft
last 12 mo · ≤1 miLoading sold comps…