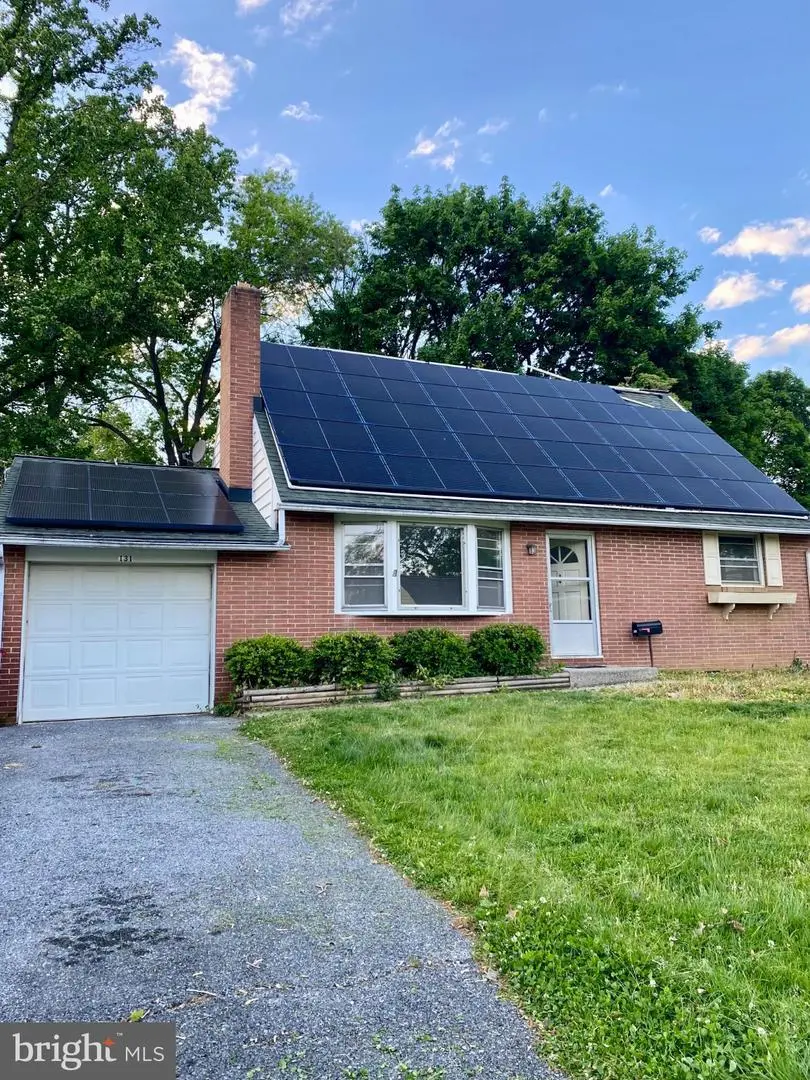
131 New St
Millersville, PA 17551
$289,900D
3 bd · 1.5 ba ·
1,536 sqft ·
Built 1960
· SingleFamily
· Pending
· 16 DOM
Cashflow @ list (25.0% down · 7.5%)
Estimated rent
$2,263/mo
Mortgage (P&I)
−$1,520
Tax + insurance
−$521
HOA
−$0
Vac / Maint / Mgmt
−$475
Net cashflow
$-253/mo
Annual
$-3,034/yr
Cap rate
5.25%
Cash-on-cash
-3.74%
DSCR
0.83
1% rule
0.78%
Cash to close
$81,172
Investor read
- This is a 3-bed/1.5-bath single-family listed at $290k.
- At list price, monthly cash flow is $-253 ($-3k/yr) — negative.
- To cash-flow at today's rent, offer at most $245k (15.4% below list).
- To meet the 1% rule (rent ≥ 1% of price), the offer needs to be $226k (21.9% below list).
- It's been on market 16 days — a 2% lower offer ($286k) is reasonable based on typical stale-listing flexibility.
- Recommended offer: $226k (21.9% below list) — sets the bar for 1% rule.
- Local home prices are declining (-3.0%/yr); year-one equity from $2k of loan paydown is wiped out by about $9k of value loss. Plan a longer hold.
- Location reads 84/100 on livability (#101 in PA, #728 nationally) — a professional / high-income tenant draw. Strengths: crime A+, cost of living A+, housing A+; Watch: amenities D-, commute F.
- Penn Manor SD (suburban): math 52% / reading 65% proficiency, ranked #80 of 539 in PA (top 15%) — acceptable for families but not a draw, mixed tenant base, ~2y average lease.
- Zoned schools: Eshleman El Sch (math 57% / reading 72%, grade B, #249 of 1,518 statewide, top 19%, 341 students, 45% FRL); Manor Middle School (math 39% / reading 58%, grade C-, #146 of 512 statewide, top 30%, 492 students, 54% FRL); Penn Manor Hs (math 82% / reading 30%, grade C, #90 of 437 statewide, top 21%, 1,783 students, 43% FRL) — zoned schools average 47% FRL vs 27% district-wide (20 pts higher); higher-poverty schools than district average — tighter screening recommended.
- Market conditions: 50 active listings in the ZIP; 5 comparable units currently listed for rent nearby; rentals leasing fast (median 14d on market — plan ~1-2 weeks tenant-placement turnaround); 1,093 units permitted in Lancaster County in 2024 (201 in 5+ unit buildings).
- Lancaster County population projected at +5% by 2050 — modest demand growth; plan on rents tracking national, not racing it.
- 2 sale attempts since 22y ago; this cycle's ask has dropped $40k (12%) from the opening price — seller is motivated, your offer sets the floor, not the list.
- Current owner paid $135k; list at $290k implies a 115% gain — meaningful room to come down on a strong offer.
- Climate carrying-cost: extreme-heat days projected 7→15/yr by 2055 (HVAC capex compounding) — expect insurance premiums to compound above CPI over the hold.
- Cap rate 5.2% vs local median 3.0% in Millersville — top-decile yield for the area; either an underpriced asset or a hidden risk that comps aren't pricing in. Stress-test before assuming the spread holds.
- This rent runs 40% of the median local income ($69k/yr) — at the standard rent-burdened threshold; future hikes will face affordability resistance.
Questions for listing agent
- What do current leases actually rent for vs. the listed asking? Can we see a recent rent roll and the last 12 months of T-12 income?
- Built in 1960 — when were the roof, HVAC, electrical panel, plumbing, and water heater last replaced?
- Is there a deadline driving the sale (1031 exchange, divorce, estate, relocation)? That informs how much negotiation room exists.
- Schools are A-rated — typically a magnet for longer-tenancy family renters. What's the average tenant stay here, and is there a school-zone premium baked into asking?
- The area grade is low — what's the realistic commute time and amenity access for the typical tenant pool here? Any planned neighborhood developments (good or bad) we should know about?
- What's the average days-on-market for RENTAL listings here right now (not sales)? A rising rental-DOM trend means longer vacancies and softer asking-rent achievability than the comps imply.
- What's the recent tenant-quality profile in this submarket — average credit score on applications, eviction rate, late-payment / NSF rate, and stable-employment percentage? A property-management company in the area should have these aggregated.
- How much new for-sale + rental construction is in the pipeline within 1–3 miles? Heavy new supply typically softens prices + rents 12–24 months out; constrained supply supports both.
CashFlowRE · CFR-ZDFMMF4Q7CMA8J
· Data 3 weeks ago
cashflowre.app · 2026-05-29