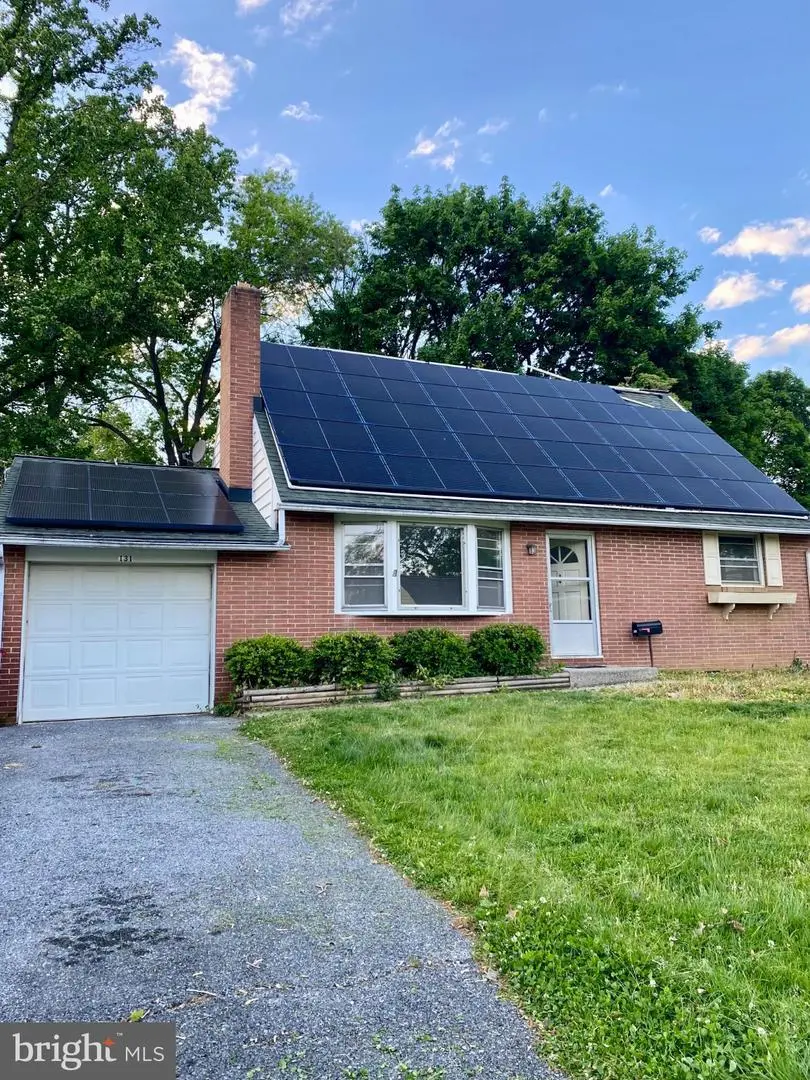
131 New St · Millersville, PA
Flood risk 1/10 · Minimal
- FEMA flood zone
- X (unshaded)
- Chance of flooding over 30 yrs
- 0.0%
- Est. flood insurance / yr
- $473 – $860
Fire risk 1/10 · Minimal
- Est. fire insurance / yr
- $511 – $949
Heat risk 6/10 · Moderate
- Hot days now (above 102°F)
- 7 days/yr
- Hot days in 30 yrs
- 15 days/yr
Wind risk 4/10 · Minor
- Chance of severe wind over 30 yrs
- 16.0%
Air-quality risk 3/10 · Minor
- Unhealthy air days now
- 2 days/yr
- Unhealthy air days in 30 yrs
- 6 days/yr
Risk factors via First Street. Map © Google.
Why this score? — see what drove the D grade
The composite is a weighted blend of 9 inputs, each scored 0–100. Each bar is that input's sub-score; the figure is the points it added to the 100-point composite (weight × sub-score).
- ARV discount +15.0/15.0
- Cash flow +8.5/30.0
- Schools +5.1/10.0
- Livability +4.2/5.0
- 1% rule +2.8/10.0
- Rent growth +2.5/5.0
- Condition / age +2.5/5.0
- DSCR +2.3/10.0
- Appreciation +0.0/10.0
$289,900
🖨 Deal sheet 📄 Offer letter ✓ Due diligence
Listing remarks MLS
BRICK LIVING ROOM FIREPLACE: HARDWOOD FLOORS; 4/5 BEDROOMS; BIGGER THAN IT LOOKS!; HALF ACRE LOT; BEING SOLD AS IS; NO SELLER DISCLOSURE INFO AVAILABLE.
Key facts
- Large backyard
- Updated kitchen
- Solar panels
Tags
Property features AI
Finance
- Other: Ownership is fee simple
Exterior
- Parking: Total of 8 parking spaces; Detached 1-car garage with inside access, side entry, garage door opener and additional storage area; Driveway with 2 spaces; 5 off-street parking spaces; Parking options include driveway, off-street and parking garage
- Utilities: Public water; Public sewer; Electric service (average about $10/month; $120 past 12 months); Municipal trash not provided
- Home design: Detached property; Shingle roof; Estimated year built; Building winterized
- Construction: Brick and vinyl siding exterior; Block foundation
- Exterior features: Property in good condition; Annual ground rent payment; Solar panel system owned and fully paid off (transferable); Home energy management features; Pets allowed with no restrictions; Not in a federal flood zone
Interior
- Kitchen: No kitchen appliance details beyond washer/dryer provided
- Bedrooms: Three bedrooms on the main level; Two bedrooms on the upper level
- Flooring: Hardwood floors
- Bathrooms: One full bathroom; One half bathroom
- Heating & cooling: 90% forced air heating; Oil-fired heating; Electric hot water
- Interior features: One fireplace; Partially finished basement with interior access, outside entrance, and connecting stairway; Not furnished
- Laundry & utility: Washer and dryer; Laundry located in the basement
Neighborhood map
What this means for you Summary
Snapshot
- This is a 3-bed/1.5-bath single-family listed at $290k.
Deal economics
- At list price, monthly cash flow is $-253 ($-3k/yr) — negative.
- To cash-flow at today's rent, offer at most $245k (15.4% below list).
- To meet the 1% rule (rent ≥ 1% of price), the offer needs to be $226k (21.9% below list).
- Recommended offer: $226k (21.9% below list) — sets the bar for 1% rule.
- Cap rate 5.2% vs local median 3.0% in Millersville — top-decile yield for the area; either an underpriced asset or a hidden risk that comps aren't pricing in. Stress-test before assuming the spread holds.
Location & tenants
- Location reads 84/100 on livability (#101 in PA, #728 nationally) — a professional / high-income tenant draw. Strengths: crime A+, cost of living A+, housing A+; Watch: amenities D-, commute F.
- Penn Manor SD (suburban): math 52% / reading 65% proficiency, ranked #80 of 539 in PA (top 15%) — acceptable for families but not a draw, mixed tenant base, ~2y average lease.
- Zoned schools: Eshleman El Sch (math 57% / reading 72%, grade B, #249 of 1,518 statewide, top 19%, 341 students, 45% FRL); Manor Middle School (math 39% / reading 58%, grade C-, #146 of 512 statewide, top 30%, 492 students, 54% FRL); Penn Manor Hs (math 82% / reading 30%, grade C, #90 of 437 statewide, top 21%, 1,783 students, 43% FRL) — zoned schools average 47% FRL vs 27% district-wide (20 pts higher); higher-poverty schools than district average — tighter screening recommended.
- Market conditions: 50 active listings in the ZIP; 5 comparable units currently listed for rent nearby; rentals leasing fast (median 14d on market — plan ~1-2 weeks tenant-placement turnaround); 1,093 units permitted in Lancaster County in 2024 (201 in 5+ unit buildings).
- This rent runs 40% of the median local income ($69k/yr) — at the standard rent-burdened threshold; future hikes will face affordability resistance.
Forward outlook
- Local home prices are declining (-3.0%/yr); year-one equity from $2k of loan paydown is wiped out by about $9k of value loss. Plan a longer hold.
- Lancaster County population projected at +5% by 2050 — modest demand growth; plan on rents tracking national, not racing it.
Negotiation context
- It's been on market 16 days — a 2% lower offer ($286k) is reasonable based on typical stale-listing flexibility.
- 2 sale attempts since 22y ago; this cycle's ask has dropped $40k (12%) from the opening price — seller is motivated, your offer sets the floor, not the list.
- Current owner paid $135k; list at $290k implies a 115% gain — meaningful room to come down on a strong offer.
Risks & watch-outs
- Climate carrying-cost: extreme-heat days projected 7→15/yr by 2055 (HVAC capex compounding) — expect insurance premiums to compound above CPI over the hold.
Questions for the listing agent
- What do current leases actually rent for vs. the listed asking? Can we see a recent rent roll and the last 12 months of T-12 income?
- Built in 1960 — when were the roof, HVAC, electrical panel, plumbing, and water heater last replaced?
- Is there a deadline driving the sale (1031 exchange, divorce, estate, relocation)? That informs how much negotiation room exists.
- Schools are A-rated — typically a magnet for longer-tenancy family renters. What's the average tenant stay here, and is there a school-zone premium baked into asking?
- The area grade is low — what's the realistic commute time and amenity access for the typical tenant pool here? Any planned neighborhood developments (good or bad) we should know about?
- What's the average days-on-market for RENTAL listings here right now (not sales)? A rising rental-DOM trend means longer vacancies and softer asking-rent achievability than the comps imply.
- What's the recent tenant-quality profile in this submarket — average credit score on applications, eviction rate, late-payment / NSF rate, and stable-employment percentage? A property-management company in the area should have these aggregated.
- How much new for-sale + rental construction is in the pipeline within 1–3 miles? Heavy new supply typically softens prices + rents 12–24 months out; constrained supply supports both.
Investment metrics
- 1% rule
- 0.78% ✗
- Cap rate
- 5.25%
- Cash-on-cash
- -3.74%
- DSCR
- 0.83
- GRM
- 10.7
CMA / ARV
- ARV (median comp)
- $348,318
- List price
- $289,900
- Delta
- -16.77%
- Verdict
- UNDERPRICED
- Comps
- 20 within 1.0 mi
Show comp detail 12 sales within ~0.75 mi
| Address | Dist | Beds/Ba | Sqft | Sold | Price | $/sf | Match |
|---|---|---|---|---|---|---|---|
| 410 Spring Dr | 0.27mi | 3/1.5 | 1,542 (+0%) | 10mo | $415,000 | $269 | 79 |
| 35 W Charlotte St | 0.40mi | 3/1.5 | 1,536 (0%) | 8mo | $275,000 | $179 | 75 |
| 317 Maple Ave | 0.13mi | 2/1.0 (-1) | 1,548 (+1%) | 19mo | $275,000 | $178 | 70 |
| 19 Circle Rd | 0.19mi | 3/2.0 | 1,620 (+6%) | 22mo | $332,000 | $205 | 62 |
| 180 W Charlotte St | 0.74mi | 3/1.5 | 1,571 (+2%) | 11mo | $360,000 | $229 | 52 |
| 39 N Prince St | 0.64mi | 2/1.5 (-1) | 1,648 (+7%) | 3mo | $225,000 | $137 | 51 |
| 164 Victoria Rd | 0.72mi | 3/2.5 | 1,500 (-2%) | 11mo | $372,000 | $248 | 50 |
| 48 Fresh Meadow Dr | 0.69mi | 3/1.5 | 1,548 (+1%) | 22mo | $340,000 | $220 | 49 |
| 39 W Cottage Ave | 0.42mi | 3/2.0 | 1,340 (-13%) | 11mo | $295,000 | $220 | 48 |
| 202 Manor Ave | 0.45mi | 3/2.5 | 1,677 (+9%) | 15mo | $350,000 | $209 | 47 |
| 30 Wabank Rd | 0.55mi | 3/1.5 | 1,352 (-12%) | 15mo | $348,000 | $257 | 42 |
| 41 Fresh Meadow Dr | 0.75mi | 3/2.0 | 1,695 (+10%) | 20mo | $325,000 | $192 | 29 |
Match score weights: distance 35% · size 25% · config 20% · recency 20%. Top-matched comps best support the ARV.
Projected returns pro-forma
-3.0% appreciation · 3.0% rent growth · sell at horizon
- IRR
- -22.6%
- Equity multiple
- 0.22×
- Total profit
- $-63,021
- Equity at exit
- $43,225
- IRR
- -16.7%
- Equity multiple
- 0.07×
- Total profit
- $-75,380
- Equity at exit
- $25,065
Cash invested: $81,172 (down + closing). Projections, not guarantees.
Landlord ↔ Tenant lean methodology
- Overall (STATE)
- 62 Landlord-Friendly
- State Pennsylvania
- 62 Landlord-Friendly · EVEN
- County
- — inherits STATE
- City
- — inherits STATE
ZIP-level market 17551
- Home prices YoY
- -24.9%
- Active inventory
- 50
- Price-to-rent
- 10.7×
Monthly cashflow live
- Estimated rent
- $2,263 high interval (Pro) →
- Mortgage (P&I)
- −$1,520
- Tax from tax record
- −$400 /mo · $4,799/yr
- Insurance
- −$121
- HOA
- −$0
- Vacancy / Maint / Mgmt
- −$475
- Net cashflow
- $-253
Break-even live
UW: 25.0% down · 7.5% · 30yr · 1.5% tax · 5.0% vac · 8.0% maint · 8.0% mgmt
Financing live
Cash to close
- Down payment
- $72,475
- Closing costs
- $8,697
- Reserves months
- —
- Total cash needed
- —
Loan-product check · same deal, 3 products live
Conventional
25% down · 7.5% · 30yr
- Down + closing
- —
- Monthly P&I
- —
- Monthly cashflow
- —
- DSCR
- —
- Eligible?
- —
Personal DTI + credit; lowest rate.
DSCR
20% down · 8.5% · 30yr
- Down + closing
- —
- Monthly P&I
- —
- Monthly cashflow
- —
- DSCR
- —
- Eligible?
- —
No personal income docs; deal must DSCR.
Hard money
10% down · 12.0% · 12mo
- Down + closing
- —
- Monthly P&I
- —
- Monthly cashflow
- —
- DSCR
- —
- Eligible?
- —
Short-term bridge; refi at stabilization.
Rent comps 5 comps
| Address | Beds | Baths | Sqft | Rent | $/sqft | DOM | Units | Dist |
|---|---|---|---|---|---|---|---|---|
| 345 Barbara St Millersville, PA | 4.0 | 2.0 | 2000 | $3,200 | $1.60 | 13d | 1 | 0.32mi |
| 127 N Prince St Unit 129 Millersville, PA | 2.0 | 1.0 | 1776 | $1,550 | $0.87 | 43d | 1 | 0.61mi |
| 43 Baron Dr Lancaster, PA | 3.0 | 2.0 | 1351 | $2,125 | $1.57 | 13d | 7 | 0.74mi |
| 100 Country View Ln Millersville, PA | 1.0–2.0 | 1.0–2.0 | 970 | $1,838 | $1.89 | 13d | 6 | 1.03mi |
| 1116 Williamsburg Rd Lancaster, PA | 3.0 | 1.5 | 1400 | $1,950 | $1.39 | 13d | 1 | 1.27mi |
Listing history 5 events
-
2026-05-08$329,900 Active 862-char remark
-
2004-04-29soldstatus $135,000
-
2004-04-23soldstatus $135,000 152-char remark
Show marketing remark (152 chars)
BRICK LIVING ROOM FIREPLACE: HARDWOOD FLOORS; 4/5 BEDROOMS; BIGGER THAN IT LOOKS!; HALF ACRE LOT; BEING SOLD AS IS; NO SELLER DISCLOSURE INFO AVAILABLE.
-
2004-03-03historical 152-char remark
Show marketing remark (152 chars)
BRICK LIVING ROOM FIREPLACE: HARDWOOD FLOORS; 4/5 BEDROOMS; BIGGER THAN IT LOOKS!; HALF ACRE LOT; BEING SOLD AS IS; NO SELLER DISCLOSURE INFO AVAILABLE.
-
2004-01-22$135,000 152-char remark
Show marketing remark (152 chars)
BRICK LIVING ROOM FIREPLACE: HARDWOOD FLOORS; 4/5 BEDROOMS; BIGGER THAN IT LOOKS!; HALF ACRE LOT; BEING SOLD AS IS; NO SELLER DISCLOSURE INFO AVAILABLE.
ⓘ Source: listings_history table (triggers on properties + properties_extension) + one-shot
backfill from property_details.listing_events for pre-trigger history.
Tax reassessment forecast PA · Partial reset (capped growth)
- Current annual tax
- $4,799 · $400/mo
- Projected year-2 tax
- $4,799 · $400/mo
- Expected delta
- $0/yr ($0/mo · 0.0%)
ⓘ Screening estimate from a state-policy table — verify with the county assessor before closing.
Climate risk First Street
- Flood 1/10 Low FEMA zone X (unshaded) · 0% chance over 30 yrs
- Wildfire 1/10 Low
- Heat 6/10 Major 7 d/yr ≥102°F today · 15 d/yr by 30 yrs out
- Wind 4/10 Moderate 16% chance of damaging wind over 30 yrs
- Air quality 3/10 Moderate 2 unhealthy d/yr today · 6 by 30 yrs out
Nearby sold comps map
Loading sold comps map…
Walkable amenities ~0.75 mi
Loading nearby amenities…
Taxation est. · year 1
- Rental income
- $27,162
- − Mortgage interest
- −$16,239
- − Property taxes
- −$4,799
- − Insurance
- −$1,450
- − Repairs & maintenance
- −$2,173
- − Management
- −$2,173
- − Depreciation
- −$8,433
- Taxable loss
- −$8,105
- Est. tax savings @ 24.0%
- +$1,945
- After-tax cash flow
- $-1,089/yr
For passive investors: Depreciation is non-cash, so a rental often shows a tax loss while cash-flowing — sheltering income. Rental losses are passive: they offset passive income freely, and up to $25,000/yr can offset ordinary (W-2) income if you actively participate and your MAGI is under $100k (phasing out to $0 by $150k); unused losses carry forward. On sale, claimed depreciation is recaptured at up to 25%, and gains may owe capital-gains tax (a 1031 exchange can defer both). Figures are a year-1 estimate at your 24.0% rate — not tax advice; consult a CPA.
Schools (NCES district)
- District
- Penn Manor SD
- NCES district ID
- 4218630
- Math proficiency
- 52% ▼ -7.00%
- Reading proficiency
- 65% ▼ -7.00%
- Median HH income
- $59,275
- Composite
- 50.67/100
- National rank
- #1826
- State rank
- #80 of 539 in PA
Livability — Millersville
- Score
- 84/100
- State rank
- #101
- US rank
- #728
Category grades
Schools grade is shown separately in the Schools card above.
Census & demographics
- Census place
- Millersville, PA
- County
- Lancaster County · 390,309 people
- City population
- 11,753
- Metro
- Lancaster, PA
- Population (ZIP)
- 11,753
- Household income
- $68,661
- Rent vs Own
- Severe rent burden
- 454.0
Population outlook (Lancaster County) Hauer SSP2
- Today (2025)
- 561,011 people
- By 2030
- 570,969 · +1.8%
- By 2040
- 585,929 · +4.4%
- By 2050
- 591,056 · +5.4%
- By 2075
- 594,747 · +6.0%
- By 2100
- 558,850 · -0.4%
Race, ethnicity, and origin ACS 2023
- Neighborhood character
- Predominantly White (76%)
- Race & ethnicity
- White 76% Hispanic / Latino 9% Asian 7% Two or more races 7% Black 3%
- Hispanic origin (detail)
- Mexican 1% Puerto Rican 6%
- Common ancestry
- Romanian 4% Italian 3% Portuguese 2%
- Foreign-born
- 8% · South Korea, Canada, India
- Languages at home
- 87% English-only · Spanish 6% Other Indo-European 5% Chinese 1%
Political lean MEDSL · Lancaster
- 2024 margin
- R (+15.9) · D 41.5% · R 57.5%
- 2008→2024 swing
- -4.1pp toward R · 2008: -11.8pp · 2024: -15.9pp
- All cycles
- 2024: R+15.9 2020: R+15.8 2016: R+19.7 2012: R+19.2 2008: R+11.8
Not yet ingested
- Civics
- —
Market trends
- HPI YoY
- ▼ -85.18%
- Current HPI
- 257.5554
- Rent YoY
- —
- Metro
- Lancaster, PA
- State GDP YoY
- ▲ 1.68%
- F500 in state
- 34
Industry mix (Fortune 500 HQ in PA)
| Industry | F500 HQs | Revenue |
|---|---|---|
| Healthcare | 2 | $309B |
|
||
| Insurance | 2 | $27B |
|
||
| Telecommunications / Media | 1 | $124B |
|
||
| Industrial Distribution | 1 | $22B |
|
||
| Financial Services | 1 | $20B |
|
||
| Chemicals / Materials | 1 | $18B |
|
||
Price history
+114.7% since first listed7 events — show timeline
- 2026-05-24 Pending — BRIGHT MLS
- 2026-05-20 Price Changed $289,900 BRIGHT MLS
- 2026-05-08 Listed $329,900 BRIGHT MLS
- 2004-04-29 Sold (Public Records) $135,000 Public Records
- 2004-04-23 Sold (MLS) $135,000 BRIGHT MLS
- 2004-03-03 Listing Removed — BRIGHT MLS
- 2004-01-22 Listed $135,000 BRIGHT MLS
Property tax history
+3.4%/yrLatest (2026): $4,799 · +6.0% YoY. Source: county tax records.
Cash-flow waterfall
monthlySold comps — $/sqft
last 12 mo · ≤1 miLoading sold comps…