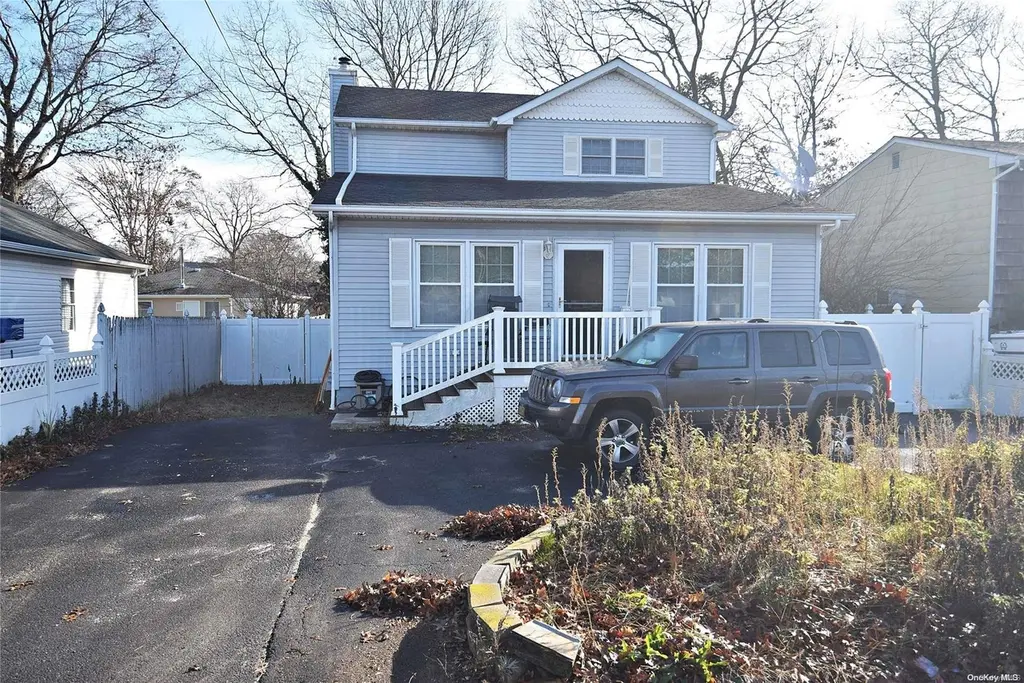
309 William Floyd Pkwy
Shirley, NY 11967
$449,000D+
3 bd · 2.5 ba ·
1,516 sqft ·
Built 2003
· SingleFamily
· Pending
· 97 DOM
Cashflow @ list (25.0% down · 7.5%)
Estimated rent
$4,164/mo
Mortgage (P&I)
−$2,355
Tax + insurance
−$964
HOA
−$0
Vac / Maint / Mgmt
−$874
Net cashflow
$-28/mo
Annual
$-342/yr
Cap rate
6.22%
Cash-on-cash
-0.27%
DSCR
0.99
1% rule
0.93%
Cash to close
$125,720
Investor read
- This is a 3-bed/2.5-bath single-family listed at $449k.
- At list price, monthly cash flow is $-28 ($-342/yr) — negative.
- To cash-flow at today's rent, offer at most $444k (1.1% below list).
- To meet the 1% rule (rent ≥ 1% of price), the offer needs to be $416k (7.3% below list).
- It's been on market 97 days — a 9% lower offer ($409k) is reasonable based on typical stale-listing flexibility.
- Recommended offer: $409k (9.0% below list) — sets the bar for market timing.
- Local home prices are declining (-3.0%/yr); year-one equity from $3k of loan paydown is wiped out by about $13k of value loss. Plan a longer hold.
- Location reads 62/100 on livability (#886 in NY) — a middle-class / working-renter tenant base. Strengths: employment A+, housing A+; Watch: crime D+, amenities F, commute F.
- William Floyd Union Free School District (suburban): math 48% / reading 57% proficiency, ranked #309 of 590 in NY (top 52%) — acceptable for families but not a draw, mixed tenant base, ~2y average lease.
- Zoned schools: John S Hobart Elementary School (math 48% / reading 42%, grade D-, #1,274 of 2,108 statewide, top 61%, 798 students, 58% FRL); William Floyd Middle School (math 36% / reading 47%, grade F, #394 of 729 statewide, top 55%, 1,053 students, 54% FRL); William Floyd High School (math 65% / reading 87%, grade A-, #616 of 1,100 statewide, top 57%, 3,013 students, 54% FRL).
- Market conditions: 187 active listings in the ZIP; 5 comparable units currently listed for rent nearby; rentals leasing fast (median 0d on market — plan ~1-2 weeks tenant-placement turnaround); 1,366 units permitted in Suffolk County in 2024 (216 in 5+ unit buildings).
- Suffolk County population projected to shrink 5% by 2050 — rents likely to lag national; underwrite the cash flow, not the appreciation.
- 5 sale attempts since 13y ago; this cycle's ask has dropped $51k (10%) from the opening price — seller is motivated, your offer sets the floor, not the list.
- Current owner paid $160k; list at $449k implies a 181% gain — meaningful room to come down on a strong offer.
- Cap rate 6.2% vs local median 4.7% in Shirley — top-decile yield for the area; either an underpriced asset or a hidden risk that comps aren't pricing in. Stress-test before assuming the spread holds.
Questions for listing agent
- What do current leases actually rent for vs. the listed asking? Can we see a recent rent roll and the last 12 months of T-12 income?
- It's been on market 97 days. Have you received any prior offers? Is the seller open to a 9% concession, seller financing, or rate buy-down credit?
- Why hasn't it sold? Are there any deal-killer items the seller is aware of (foundation, flood, title, zoning, code violations)?
- Is there a deadline driving the sale (1031 exchange, divorce, estate, relocation)? That informs how much negotiation room exists.
- Schools are F-rated, which usually means shorter tenancies and higher turnover. Who's the typical renter profile here, and what's been the actual vacancy rate?
- Crime grade is D in this area — have there been break-ins, vandalism, or insurance claims at this property in the last 3 years? What carrier currently insures it and at what premium?
- The area grade is low — what's the realistic commute time and amenity access for the typical tenant pool here? Any planned neighborhood developments (good or bad) we should know about?
- What's the average days-on-market for RENTAL listings here right now (not sales)? A rising rental-DOM trend means longer vacancies and softer asking-rent achievability than the comps imply.
CashFlowRE · CFR-ZDYRX60YZ3VATS
· Data 4 weeks ago
cashflowre.app · 2026-05-29