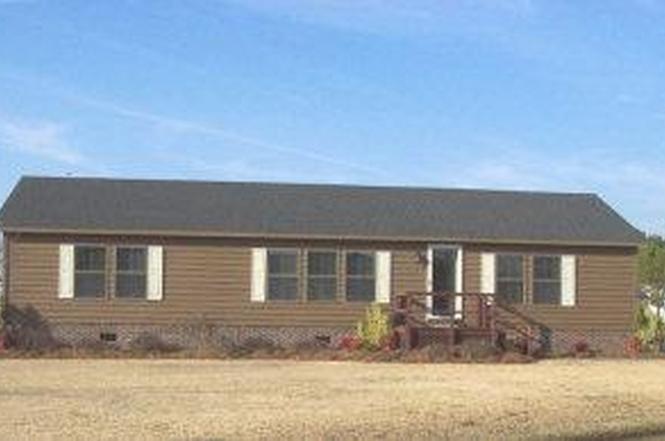
429 Sand Dollar Dr
Gloucester, NC 28528
$175,000C-
3 bd · 2.0 ba ·
1,512 sqft ·
Built 1994
· Manufactured
· Active
· 95 DOM
Cashflow @ list (25.0% down · 7.5%)
Estimated rent
$1,228/mo
Mortgage (P&I)
−$918
Tax + insurance
−$192
HOA
−$0
Vac / Maint / Mgmt
−$258
Net cashflow
$-140/mo
Annual
$-1,675/yr
Cap rate
5.79%
Cash-on-cash
-1.79%
DSCR
0.92
1% rule
0.70%
Cash to close
$49,000
Investor read
- This is a 3-bed/2.0-bath manufactured listed at $175k.
- At list price, monthly cash flow is $-140 ($-2k/yr) — negative.
- To cash-flow at today's rent, offer at most $150k (14.1% below list).
- To meet the 1% rule (rent ≥ 1% of price), the offer needs to be $123k (29.8% below list).
- It's been on market 95 days — a 9% lower offer ($159k) is reasonable based on typical stale-listing flexibility.
- Recommended offer: $123k (29.8% below list) — sets the bar for 1% rule.
- In year one you build about $9k of equity ($1k loan paydown + $7k appreciation (4.2% local appreciation)).
- Location reads 55/100 on livability (#658 in NC) — a working-class tenant base; expect higher turnover. Strengths: cost of living A+; Watch: crime F, amenities F, commute F.
- Carteret County Public Schools (rural): math 59% / reading 61% proficiency, ranked #31 of 178 in NC (top 17%) — acceptable for families but not a draw, mixed tenant base, ~2y average lease.
- Zoned schools: Down East Middle And Smyrna Elementary (math 48% / reading 60%, grade C, #328 of 1,410 statewide, top 24%, 249 students, 99% FRL); East Carteret High (math 82% / reading 62%, grade B+, #107 of 535 statewide, top 21%, 530 students, 45% FRL) — zoned schools average 72% FRL vs 39% district-wide (33 pts higher); higher-poverty schools than district average — tighter screening recommended.
- Watch-outs: flood insurance adds $66/mo.
- Market conditions: 8 active listings in the ZIP; 935 units permitted in Carteret County in 2024 (360 in 5+ unit buildings).
- Carteret County population projected at +9% by 2050 — modest demand growth; plan on rents tracking national, not racing it.
- 2 sale attempts since 22y ago with the ask held roughly flat each time — persistent listings suggest the price (not the market) is what's stuck; bring a comps-based counter.
- Current owner paid $86k; list at $175k implies a 105% gain — meaningful room to come down on a strong offer.
- By year 5, paydown + projected appreciation supports a ~$37k cash-out refi (75% LTV) — recoverable capital for the next deal without selling this one.
- Climate carrying-cost: severe flood risk; severe wind risk, 99% chance of damaging wind over 30y; moderate wildfire risk; extreme-heat days projected 7→22/yr by 2055 (HVAC capex compounding) — expect insurance premiums to compound above CPI over the hold.
Questions for listing agent
- What do current leases actually rent for vs. the listed asking? Can we see a recent rent roll and the last 12 months of T-12 income?
- It's been on market 95 days. Have you received any prior offers? Is the seller open to a 30% concession, seller financing, or rate buy-down credit?
- What's the actual annual flood-insurance premium (NFIP or private), and is the property in a SFHA with mandatory coverage?
- Why hasn't it sold? Are there any deal-killer items the seller is aware of (foundation, flood, title, zoning, code violations)?
- Is there a deadline driving the sale (1031 exchange, divorce, estate, relocation)? That informs how much negotiation room exists.
- Crime grade is F in this area — have there been break-ins, vandalism, or insurance claims at this property in the last 3 years? What carrier currently insures it and at what premium?
- What's the average days-on-market for RENTAL listings here right now (not sales)? A rising rental-DOM trend means longer vacancies and softer asking-rent achievability than the comps imply.
- What's the recent tenant-quality profile in this submarket — average credit score on applications, eviction rate, late-payment / NSF rate, and stable-employment percentage? A property-management company in the area should have these aggregated.
CashFlowRE · CFR-ZEPRMR4BA077D8
· Data 1 week ago
cashflowre.app · 2026-05-29