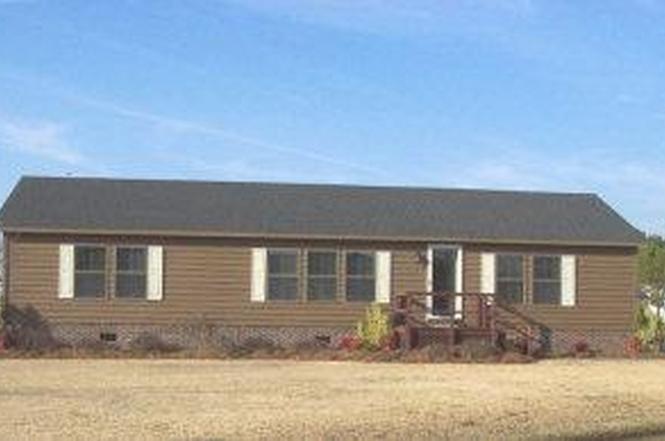
429 Sand Dollar Dr · Gloucester, NC
Flood risk 8/10 · Major
- FEMA flood zone
- X (shaded)
- Chance of flooding over 30 yrs
- 0.98%
- Est. flood insurance / yr
- $507 – $1,088
Fire risk 5/10 · Moderate
- Est. fire insurance / yr
- $906 – $1,684
Heat risk 9/10 · Severe
- Hot days now (above 103°F)
- 7 days/yr
- Hot days in 30 yrs
- 22 days/yr
Wind risk 9/10 · Severe
- Chance of severe wind over 30 yrs
- 99.0%
Air-quality risk 1/10 · Minimal
- Unhealthy air days now
- 0 days/yr
- Unhealthy air days in 30 yrs
- 0 days/yr
Risk factors via First Street. Map © Google.
Why this score? — see what drove the C- grade
The composite is a weighted blend of 9 inputs, each scored 0–100. Each bar is that input's sub-score; the figure is the points it added to the 100-point composite (weight × sub-score).
- ARV discount +15.0/15.0
- Cash flow +11.0/30.0
- Appreciation +7.1/10.0
- Schools +5.1/10.0
- DSCR +3.2/10.0
- Livability +2.8/5.0
- Rent growth +2.5/5.0
- Condition / age +2.5/5.0
- 1% rule +2.0/10.0
$175,000
🖨 Deal sheet 📄 Offer letter ✓ Due diligence
Listing remarks MLS
OPEN FLOOR PLAN IN LIKE NEW CONDITTION. CEDAR SIDING, NEW BACK DECK, OUTSIDE STORAGE SHED INCLUDES STOVE, HOOD, DISHWASHER & REFRIGERATOR IDEAL LOCATION ON A CUL-DA- SAK $1,000 SELLING BONUS TO SA WITH BIC APPROVAL
Key facts
- Coastal area home
- Public boat ramp
- 0.48 acre lot
Tags
Property features AI
Exterior
- Parking: Off-street parking
- Utilities: Septic tank; Utilities: See remarks
- Home design: Manufactured home; Single-story (one level); Entry on level 1
- Construction: Wood siding and frame construction; Shingle roof
- Exterior features: Deck; Shed(s); Paved road access; No fencing listed
Interior
- Bathrooms: 2 full bathrooms
- Heating & cooling: Central air conditioning; Electric heating; Heat pump
- Interior features: Crawl space basement; 5 total rooms; Has a view
Neighborhood map
What this means for you Summary
Snapshot
- This is a 3-bed/2.0-bath manufactured listed at $175k.
Deal economics
- At list price, monthly cash flow is $-140 ($-2k/yr) — negative.
- To cash-flow at today's rent, offer at most $150k (14.1% below list).
- To meet the 1% rule (rent ≥ 1% of price), the offer needs to be $123k (29.8% below list).
- Recommended offer: $123k (29.8% below list) — sets the bar for 1% rule.
Location & tenants
- Location reads 55/100 on livability (#658 in NC) — a working-class tenant base; expect higher turnover. Strengths: cost of living A+; Watch: crime F, amenities F, commute F.
- Carteret County Public Schools (rural): math 59% / reading 61% proficiency, ranked #31 of 178 in NC (top 17%) — acceptable for families but not a draw, mixed tenant base, ~2y average lease.
- Zoned schools: Down East Middle And Smyrna Elementary (math 48% / reading 60%, grade C, #328 of 1,410 statewide, top 24%, 249 students, 99% FRL); East Carteret High (math 82% / reading 62%, grade B+, #107 of 535 statewide, top 21%, 530 students, 45% FRL) — zoned schools average 72% FRL vs 39% district-wide (33 pts higher); higher-poverty schools than district average — tighter screening recommended.
- Market conditions: 8 active listings in the ZIP; 935 units permitted in Carteret County in 2024 (360 in 5+ unit buildings).
Forward outlook
- In year one you build about $9k of equity ($1k loan paydown + $7k appreciation (4.2% local appreciation)).
- Carteret County population projected at +9% by 2050 — modest demand growth; plan on rents tracking national, not racing it.
- By year 5, paydown + projected appreciation supports a ~$37k cash-out refi (75% LTV) — recoverable capital for the next deal without selling this one.
Negotiation context
- It's been on market 95 days — a 9% lower offer ($159k) is reasonable based on typical stale-listing flexibility.
- 2 sale attempts since 22y ago with the ask held roughly flat each time — persistent listings suggest the price (not the market) is what's stuck; bring a comps-based counter.
- Current owner paid $86k; list at $175k implies a 105% gain — meaningful room to come down on a strong offer.
Risks & watch-outs
- Watch-outs: flood insurance adds $66/mo.
- Climate carrying-cost: severe flood risk; severe wind risk, 99% chance of damaging wind over 30y; moderate wildfire risk; extreme-heat days projected 7→22/yr by 2055 (HVAC capex compounding) — expect insurance premiums to compound above CPI over the hold.
Questions for the listing agent
- What do current leases actually rent for vs. the listed asking? Can we see a recent rent roll and the last 12 months of T-12 income?
- It's been on market 95 days. Have you received any prior offers? Is the seller open to a 30% concession, seller financing, or rate buy-down credit?
- What's the actual annual flood-insurance premium (NFIP or private), and is the property in a SFHA with mandatory coverage?
- Why hasn't it sold? Are there any deal-killer items the seller is aware of (foundation, flood, title, zoning, code violations)?
- Is there a deadline driving the sale (1031 exchange, divorce, estate, relocation)? That informs how much negotiation room exists.
- Crime grade is F in this area — have there been break-ins, vandalism, or insurance claims at this property in the last 3 years? What carrier currently insures it and at what premium?
- What's the average days-on-market for RENTAL listings here right now (not sales)? A rising rental-DOM trend means longer vacancies and softer asking-rent achievability than the comps imply.
- What's the recent tenant-quality profile in this submarket — average credit score on applications, eviction rate, late-payment / NSF rate, and stable-employment percentage? A property-management company in the area should have these aggregated.
- How much new for-sale + rental construction is in the pipeline within 1–3 miles? Heavy new supply typically softens prices + rents 12–24 months out; constrained supply supports both.
Investment metrics
- 1% rule
- 0.70% ✗
- Cap rate
- 5.79%
- Cash-on-cash
- -1.79%
- DSCR
- 0.92
- GRM
- 11.9
CMA / ARV
- ARV (on-the-fly)
- $252,504
- Comps found
- 1
Show comp detail 1 sale within ~0.75 mi
| Address | Dist | Beds/Ba | Sqft | Sold | Price | $/sf | Match |
|---|---|---|---|---|---|---|---|
| 112 Live Oak St | 0.39mi | 3/3.0 | 1,500 (-1%) | 9mo | $250,800 | $167 | 69 |
Match score weights: distance 35% · size 25% · config 20% · recency 20%. Top-matched comps best support the ARV.
Projected returns pro-forma
4.2% appreciation · 3.0% rent growth · sell at horizon
- IRR
- 7.8%
- Equity multiple
- 1.48×
- Total profit
- $23,483
- Equity at exit
- $90,744
- IRR
- 9.9%
- Equity multiple
- 2.69×
- Total profit
- $82,734
- Equity at exit
- $150,050
Cash invested: $49,000 (down + closing). Projections, not guarantees.
Landlord ↔ Tenant lean methodology
- Overall (STATE)
- 85 Strongly Landlord-Friendly
- State North Carolina
- 85 Strongly Landlord-Friendly · R+3
- County
- — inherits STATE
- City
- — inherits STATE
ZIP-level market 28528
- Home prices YoY
- 1.3%
- Active inventory
- 8
- Price-to-rent
- 11.9×
Monthly cashflow live
- Estimated rent
- $1,228 medium interval (Pro) →
- Mortgage (P&I)
- −$918
- Tax from tax record
- −$52 /mo · $629/yr
- Insurance
- −$73
- Flood insurance flood zone
- −$66 /mo · $798/yr
- HOA
- −$0
- Vacancy / Maint / Mgmt
- −$258
- Net cashflow
- $-140
Break-even live
UW: 25.0% down · 7.5% · 30yr · 1.5% tax · 5.0% vac · 8.0% maint · 8.0% mgmt
Financing live
Cash to close
- Down payment
- $43,750
- Closing costs
- $5,250
- Reserves months
- —
- Total cash needed
- —
Loan-product check · same deal, 3 products live
Conventional
25% down · 7.5% · 30yr
- Down + closing
- —
- Monthly P&I
- —
- Monthly cashflow
- —
- DSCR
- —
- Eligible?
- —
Personal DTI + credit; lowest rate.
DSCR
20% down · 8.5% · 30yr
- Down + closing
- —
- Monthly P&I
- —
- Monthly cashflow
- —
- DSCR
- —
- Eligible?
- —
No personal income docs; deal must DSCR.
Hard money
10% down · 12.0% · 12mo
- Down + closing
- —
- Monthly P&I
- —
- Monthly cashflow
- —
- DSCR
- —
- Eligible?
- —
Short-term bridge; refi at stabilization.
Listing history 12 events
-
2026-06-09days on market $175,000 Active 95 DOM
-
2026-06-08days on market $175,000 Active 94 DOM
-
2026-06-07days on market $175,000 Active 93 DOM
-
2026-06-05days on market $175,000 Active 90 DOM
-
2026-06-03days on market $175,000 Active 89 DOM
-
2026-06-02days on market $175,000 Active 88 DOM
-
2026-06-01days on market $175,000 Active 87 DOM
-
2026-05-31days on market $175,000 Active 86 DOM
-
2026-05-30days on market $175,000 Active 85 DOM
-
2026-03-04$175,000 Active
-
2004-07-30soldstatus $85,500 218-char remark
Show marketing remark (218 chars)
OPEN FLOOR PLAN IN LIKE NEW CONDITTION. CEDAR SIDING, NEW BACK DECK, OUTSIDE STORAGE SHED INCLUDES STOVE, HOOD, DISHWASHER & REFRIGERATOR IDEAL LOCATION ON A CUL-DA- SAK $1,000 SELLING BONUS TO SA WITH BIC APPROVAL
-
2004-03-04$88,500 218-char remark
Show marketing remark (218 chars)
OPEN FLOOR PLAN IN LIKE NEW CONDITTION. CEDAR SIDING, NEW BACK DECK, OUTSIDE STORAGE SHED INCLUDES STOVE, HOOD, DISHWASHER & REFRIGERATOR IDEAL LOCATION ON A CUL-DA- SAK $1,000 SELLING BONUS TO SA WITH BIC APPROVAL
ⓘ Source: listings_history table (triggers on properties + properties_extension) + one-shot
backfill from property_details.listing_events for pre-trigger history.
Tax reassessment forecast NC · Resets to sale price
- Current annual tax
- $629 · $52/mo
- Projected year-2 tax
- $1,435 · $120/mo
- Expected delta
- +$806/yr (+$67/mo · 128.2%)
ⓘ Screening estimate from a state-policy table — verify with the county assessor before closing.
Climate risk First Street
- Flood 8/10 Severe FEMA zone X (shaded) · 98% chance over 30 yrs
- Wildfire 5/10 Major
- Heat 9/10 Extreme 7 d/yr ≥103°F today · 22 d/yr by 30 yrs out
- Wind 9/10 Extreme 99% chance of damaging wind over 30 yrs
- Air quality 1/10 Low 0 unhealthy d/yr today · 0 by 30 yrs out
Nearby sold comps map
Loading sold comps map…
Walkable amenities ~0.75 mi
Loading nearby amenities…
Taxation est. · year 1
- Rental income
- $14,733
- − Mortgage interest
- −$9,803
- − Property taxes
- −$629
- − Insurance
- −$1,672
- − Repairs & maintenance
- −$1,179
- − Management
- −$1,179
- − Depreciation
- −$5,091
- Taxable loss
- −$4,819
- Est. tax savings @ 24.0%
- +$1,157
- After-tax cash flow
- $-518/yr
For passive investors: Depreciation is non-cash, so a rental often shows a tax loss while cash-flowing — sheltering income. Rental losses are passive: they offset passive income freely, and up to $25,000/yr can offset ordinary (W-2) income if you actively participate and your MAGI is under $100k (phasing out to $0 by $150k); unused losses carry forward. On sale, claimed depreciation is recaptured at up to 25%, and gains may owe capital-gains tax (a 1031 exchange can defer both). Figures are a year-1 estimate at your 24.0% rate — not tax advice; consult a CPA.
Schools (NCES district)
- District
- Carteret County Public Schools
- NCES district ID
- 3700630
- Math proficiency
- 59% ▲ 5.00%
- Reading proficiency
- 61% ▲ 2.00%
- Median HH income
- $48,330
- Composite
- 50.92/100
- National rank
- #1786
- State rank
- #31 of 178 in NC
Livability — Gloucester
- Score
- 55/100
- State rank
- #658
- US rank
- #23664
Category grades
Schools grade is shown separately in the Schools card above.
Census & demographics
- Census place
- Gloucester, NC
- City population
- 607
- Population (ZIP)
- 607
Population outlook (Carteret County) Hauer SSP2
- Today (2025)
- 73,443 people
- By 2030
- 75,344 · +2.6%
- By 2040
- 78,142 · +6.4%
- By 2050
- 80,091 · +9.1%
- By 2075
- 86,120 · +17.3%
- By 2100
- 89,408 · +21.7%
Race, ethnicity, and origin ACS 2023
- Neighborhood character
- Predominantly White (95%)
- Race & ethnicity
- White 95% Two or more races 2% Hispanic / Latino 1%
- Common ancestry
- Iranian 2% Lithuanian 2% Slovak 2%
- Foreign-born
- 1% · Canada
Political lean MEDSL · Carteret
- 2024 margin
- Solid R (+43.1) · D 28.0% · R 71.1%
- 2008→2024 swing
- -8.4pp toward R · 2008: -34.7pp · 2024: -43.1pp
- All cycles
- 2024: R+43.1 2020: R+42.0 2016: R+44.5 2012: R+41.0 2008: R+34.7
Not yet ingested
- Civics
- —
Market trends
- HPI YoY
- ▲ 4.20%
- Current HPI
- 329.774
- Rent YoY
- —
- Metro
- —
- State GDP YoY
- ▲ 3.28%
- F500 in state
- 26
Industry mix (Fortune 500 HQ in NC)
| Industry | F500 HQs | Revenue |
|---|---|---|
| Financial Services | 2 | $213B |
|
||
| Retail | 2 | $95B |
|
||
| Industrial Conglomerate | 1 | $38B |
|
||
| Metals / Steel | 1 | $35B |
|
||
| Utilities | 1 | $30B |
|
||
| Industrial Machinery | 1 | $19B |
|
||
Price history
+97.7% since first listed3 events — show timeline
- 2026-03-04 Listed $175,000 Hive MLS
- 2004-07-30 Sold (MLS) $85,500 Hive MLS
- 2004-03-04 Listed $88,500 Hive MLS
Property tax history
+4.1%/yrLatest (2025): $629 · +77.7% YoY. Source: county tax records.
Cash-flow waterfall
monthlySold comps — $/sqft
last 12 mo · ≤1 miLoading sold comps…