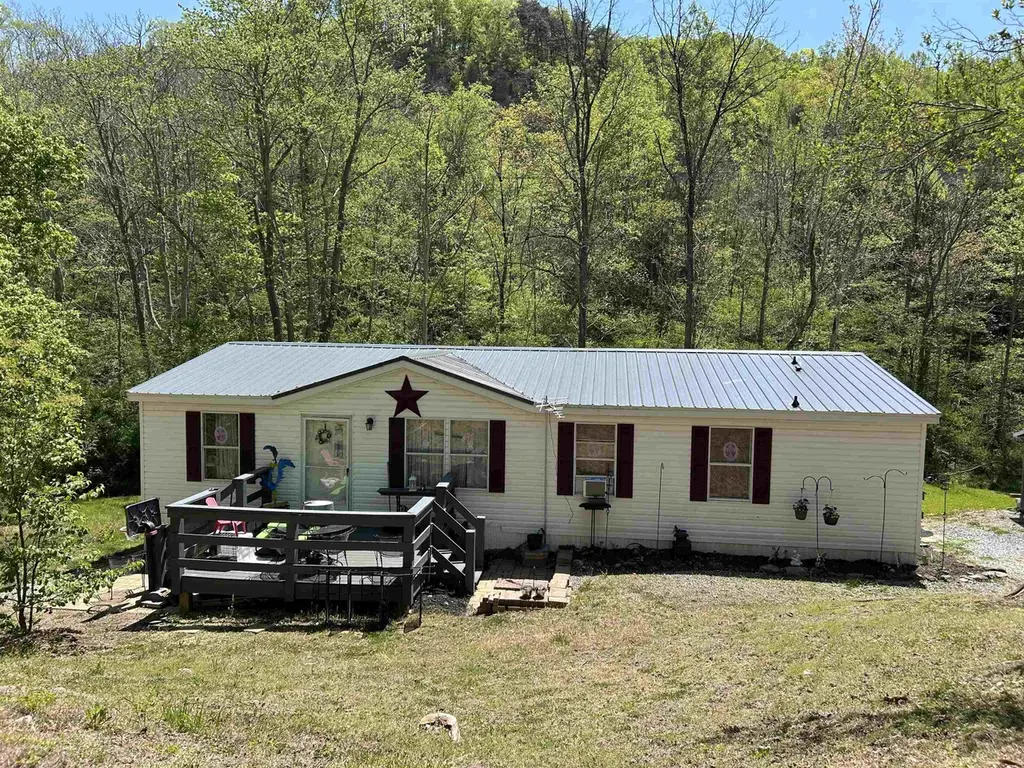
3411 Seneca Hollow Rd
Shawsville, VA 24087
$199,000B-
3 bd · 2.0 ba ·
1,152 sqft ·
Built 1999
· Manufactured
· Active
· 57 DOM
Cashflow @ list (25.0% down · 7.5%)
Estimated rent
$1,886/mo
Mortgage (P&I)
−$1,044
Tax + insurance
−$231
HOA
−$0
Vac / Maint / Mgmt
−$396
Net cashflow
$216/mo
Annual
$2,588/yr
Cap rate
7.99%
Cash-on-cash
6.08%
DSCR
1.27
1% rule
0.95%
Cash to close
$55,720
Investor read
- This is a 3-bed/2.0-bath manufactured listed at $199k.
- At list price, monthly cash flow is $216 ($3k/yr) — positive.
- The deal already cash-flows at list — no discount required.
- To meet the 1% rule (rent ≥ 1% of price), the offer needs to be $189k (5.2% below list).
- It's been on market 57 days — a 3% lower offer ($193k) is reasonable based on typical stale-listing flexibility.
- Recommended offer: $189k (5.2% below list) — sets the bar for 1% rule.
- In year one you build about $21k of equity ($1k loan paydown + $20k appreciation (10.0% local appreciation)).
- Location reads 68/100 on livability (#273 in VA) — a middle-class / working-renter tenant base. Strengths: crime A+, cost of living A+, housing A+; Watch: amenities F, commute F, health & safety F.
- Montgomery County Public School District (urban): math 57% / reading 70% proficiency, ranked #47 of 131 in VA (top 36%) — acceptable for families but not a draw, mixed tenant base, ~2y average lease.
- Zoned schools: Eastern Montgomery Elementary (math 27% / reading 42%, grade F, #966 of 1,108 statewide, top 89%, 385 students, 76% FRL); Shawsville Middle (math 41% / reading 56%, grade C-, #244 of 342 statewide, top 72%, 208 students, 74% FRL); Eastern Montgomery High (math 72% / reading 77%, grade B+, #107 of 319 statewide, top 37%, 282 students, 62% FRL) — zoned schools average 71% FRL vs 32% district-wide (39 pts higher); higher-poverty schools than district average — tighter screening recommended.
- Watch-outs: flood insurance adds $66/mo.
- Market conditions: 33 active listings in the ZIP; 323 units permitted in Montgomery County in 2024 (0 in 5+ unit buildings).
- Montgomery County population projected at +13% by 2050 — modest demand growth; plan on rents tracking national, not racing it.
- 2 sale attempts since 3y ago with the ask held roughly flat each time — persistent listings suggest the price (not the market) is what's stuck; bring a comps-based counter.
- At projected returns (10.0% appreciation + 3.0% rent growth), your $56k cash investment doubles in ~3 years — after that, you're playing with house money.
- By year 2, paydown + projected appreciation supports a ~$34k cash-out refi (75% LTV) — recoverable capital for the next deal without selling this one.
- Climate carrying-cost: severe flood risk — expect insurance premiums to compound above CPI over the hold.
Questions for listing agent
- It's been on market 57 days. Have you received any prior offers? Is the seller open to a 5% concession, seller financing, or rate buy-down credit?
- What's the actual annual flood-insurance premium (NFIP or private), and is the property in a SFHA with mandatory coverage?
- Is there a deadline driving the sale (1031 exchange, divorce, estate, relocation)? That informs how much negotiation room exists.
- Schools are B-rated — typically a magnet for longer-tenancy family renters. What's the average tenant stay here, and is there a school-zone premium baked into asking?
- What's the average days-on-market for RENTAL listings here right now (not sales)? A rising rental-DOM trend means longer vacancies and softer asking-rent achievability than the comps imply.
- What's the recent tenant-quality profile in this submarket — average credit score on applications, eviction rate, late-payment / NSF rate, and stable-employment percentage? A property-management company in the area should have these aggregated.
- How much new for-sale + rental construction is in the pipeline within 1–3 miles? Heavy new supply typically softens prices + rents 12–24 months out; constrained supply supports both.
CashFlowRE · CFR-ZEZTYN97GGEFJA
· Data 1 day ago
cashflowre.app · 2026-05-29