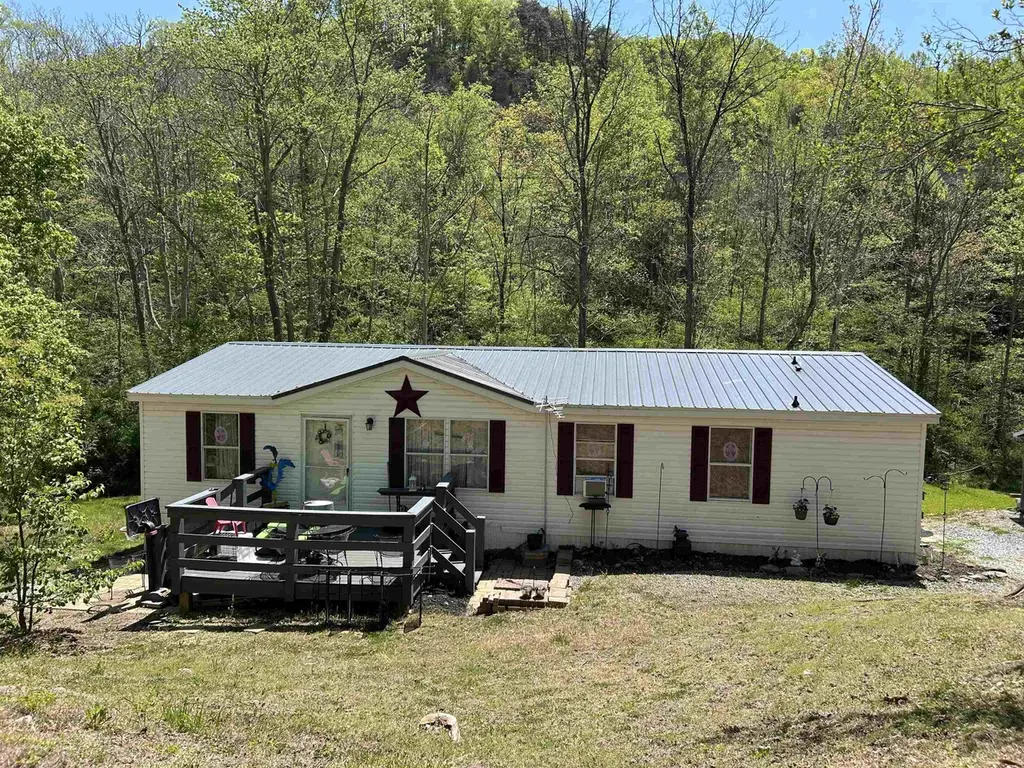
3411 Seneca Hollow Rd · Shawsville, VA
Flood risk 9/10 · Severe
- FEMA flood zone
- X (unshaded)
- Chance of flooding over 30 yrs
- 0.99%
- Est. flood insurance / yr
- $507 – $1,088
Fire risk 4/10 · Minor
- Est. fire insurance / yr
- $666 – $1,236
Heat risk 4/10 · Minor
- Hot days now (above 98°F)
- 7 days/yr
- Hot days in 30 yrs
- 19 days/yr
Wind risk 2/10 · Minimal
- Chance of severe wind over 30 yrs
- 1.0%
Air-quality risk 1/10 · Minimal
- Unhealthy air days now
- 0 days/yr
- Unhealthy air days in 30 yrs
- 0 days/yr
Risk factors via First Street. Map © Google.
Why this score? — see what drove the B- grade
The composite is a weighted blend of 9 inputs, each scored 0–100. Each bar is that input's sub-score; the figure is the points it added to the 100-point composite (weight × sub-score).
- Cash flow +21.0/30.0
- ARV discount +10.3/15.0
- Appreciation +10.0/10.0
- DSCR +6.7/10.0
- Schools +5.4/10.0
- 1% rule +4.5/10.0
- Livability +3.4/5.0
- Rent growth +2.5/5.0
- Condition / age +2.5/5.0
$199,000
🖨 Deal sheet 📄 Offer letter ✓ Due diligence
Listing remarks
Come check out this private country home located in the Eastern Montgomery School District. Home has been recently updated & is move in ready. Heat Pump & Kitchen appliances were replaced in 2021. Roof was replaced in 2024. The yard features space for entertaining & gardening with a small spring in the back. The front porch is the perfect place to have dinner while unwinding from the day.
Key facts
- Kitchen appliances
- Roof
- Recently updated
Tags
Property features AI
Exterior
- Utilities: Private well water; Septic tank sewer
- Home design: Single-family detached home; One story
- Construction: Vinyl siding
- Exterior features: Garden; Lot on approximately 2 acres
Interior
- Kitchen: Dishwasher; Microwave; Oven; Refrigerator
- Bathrooms: 2 full bathrooms
- Heating & cooling: Central air conditioning; Electric heating
- Interior features: Dishwasher; Dryer; Microwave; Oven; Refrigerator; Washer; Electric water heater; Crawl space basement
- Laundry & utility: Washer; Dryer; Electric water heater
Neighborhood map
What this means for you Summary
Snapshot
- This is a 3-bed/2.0-bath manufactured listed at $199k.
Deal economics
- At list price, monthly cash flow is $216 ($3k/yr) — positive.
- The deal already cash-flows at list — no discount required.
- To meet the 1% rule (rent ≥ 1% of price), the offer needs to be $189k (5.2% below list).
- Recommended offer: $189k (5.2% below list) — sets the bar for 1% rule.
Location & tenants
- Location reads 68/100 on livability (#273 in VA) — a middle-class / working-renter tenant base. Strengths: crime A+, cost of living A+, housing A+; Watch: amenities F, commute F, health & safety F.
- Montgomery County Public School District (urban): math 57% / reading 70% proficiency, ranked #47 of 131 in VA (top 36%) — acceptable for families but not a draw, mixed tenant base, ~2y average lease.
- Zoned schools: Eastern Montgomery Elementary (math 27% / reading 42%, grade F, #966 of 1,108 statewide, top 89%, 385 students, 76% FRL); Shawsville Middle (math 41% / reading 56%, grade C-, #244 of 342 statewide, top 72%, 208 students, 74% FRL); Eastern Montgomery High (math 72% / reading 77%, grade B+, #107 of 319 statewide, top 37%, 282 students, 62% FRL) — zoned schools average 71% FRL vs 32% district-wide (39 pts higher); higher-poverty schools than district average — tighter screening recommended.
- Market conditions: 33 active listings in the ZIP; 323 units permitted in Montgomery County in 2024 (0 in 5+ unit buildings).
Forward outlook
- In year one you build about $21k of equity ($1k loan paydown + $20k appreciation (10.0% local appreciation)).
- Montgomery County population projected at +13% by 2050 — modest demand growth; plan on rents tracking national, not racing it.
- At projected returns (10.0% appreciation + 3.0% rent growth), your $56k cash investment doubles in ~3 years — after that, you're playing with house money.
- By year 2, paydown + projected appreciation supports a ~$34k cash-out refi (75% LTV) — recoverable capital for the next deal without selling this one.
Negotiation context
- It's been on market 57 days — a 3% lower offer ($193k) is reasonable based on typical stale-listing flexibility.
- 2 sale attempts since 3y ago with the ask held roughly flat each time — persistent listings suggest the price (not the market) is what's stuck; bring a comps-based counter.
Risks & watch-outs
- Watch-outs: flood insurance adds $66/mo.
- Climate carrying-cost: severe flood risk — expect insurance premiums to compound above CPI over the hold.
Questions for the listing agent
- It's been on market 57 days. Have you received any prior offers? Is the seller open to a 5% concession, seller financing, or rate buy-down credit?
- What's the actual annual flood-insurance premium (NFIP or private), and is the property in a SFHA with mandatory coverage?
- Is there a deadline driving the sale (1031 exchange, divorce, estate, relocation)? That informs how much negotiation room exists.
- Schools are B-rated — typically a magnet for longer-tenancy family renters. What's the average tenant stay here, and is there a school-zone premium baked into asking?
- What's the average days-on-market for RENTAL listings here right now (not sales)? A rising rental-DOM trend means longer vacancies and softer asking-rent achievability than the comps imply.
- What's the recent tenant-quality profile in this submarket — average credit score on applications, eviction rate, late-payment / NSF rate, and stable-employment percentage? A property-management company in the area should have these aggregated.
- How much new for-sale + rental construction is in the pipeline within 1–3 miles? Heavy new supply typically softens prices + rents 12–24 months out; constrained supply supports both.
Investment metrics
- 1% rule
- 0.95% ✗
- Cap rate
- 7.99%
- Cash-on-cash
- 6.08%
- DSCR
- 1.27
- GRM
- 8.8
CMA / ARV
- ARV (median comp)
- $212,376
- List price
- $199,000
- Delta
- -6.30%
- Verdict
- FAIR
- Comps
- 4 within 2.0 mi
Projected returns pro-forma
10.0% appreciation · 3.0% rent growth · sell at horizon
- IRR
- 27.6%
- Equity multiple
- 3.19×
- Total profit
- $122,086
- Equity at exit
- $179,275
- IRR
- 24.1%
- Equity multiple
- 7.26×
- Total profit
- $348,652
- Equity at exit
- $386,613
Cash invested: $55,720 (down + closing). Projections, not guarantees.
Landlord ↔ Tenant lean methodology
- Overall (STATE)
- 55 Moderately Landlord-Leaning
- State Virginia
- 55 Moderately Landlord-Leaning · D+2
- County
- — inherits STATE
- City
- — inherits STATE
ZIP-level market 24087
- Home prices YoY
- 4.3%
- Active inventory
- 33
- Price-to-rent
- 8.8×
Monthly cashflow live
- Estimated rent
- $1,886 medium interval (Pro) →
- Mortgage (P&I)
- −$1,044
- Tax from tax record
- −$82 /mo · $979/yr
- Insurance
- −$83
- Flood insurance flood zone
- −$66 /mo · $798/yr
- HOA
- −$0
- Vacancy / Maint / Mgmt
- −$396
- Net cashflow
- $216
Break-even live
UW: 25.0% down · 7.5% · 30yr · 1.5% tax · 5.0% vac · 8.0% maint · 8.0% mgmt
Financing live
Cash to close
- Down payment
- $49,750
- Closing costs
- $5,970
- Reserves months
- —
- Total cash needed
- —
Loan-product check · same deal, 3 products live
Conventional
25% down · 7.5% · 30yr
- Down + closing
- —
- Monthly P&I
- —
- Monthly cashflow
- —
- DSCR
- —
- Eligible?
- —
Personal DTI + credit; lowest rate.
DSCR
20% down · 8.5% · 30yr
- Down + closing
- —
- Monthly P&I
- —
- Monthly cashflow
- —
- DSCR
- —
- Eligible?
- —
No personal income docs; deal must DSCR.
Hard money
10% down · 12.0% · 12mo
- Down + closing
- —
- Monthly P&I
- —
- Monthly cashflow
- —
- DSCR
- —
- Eligible?
- —
Short-term bridge; refi at stabilization.
Listing history 20 events
-
2026-06-19days on market $199,000 Active 57 DOM
-
2026-06-18days on market $199,000 Active 56 DOM
-
2026-06-17days on market $199,000 Active 55 DOM
-
2026-06-16days on market $199,000 Active 54 DOM
-
2026-06-15days on market $199,000 Active 53 DOM
-
2026-06-14days on market $199,000 Active 51 DOM
-
2026-06-13days on market $199,000 Active 50 DOM
-
2026-06-10days on market $199,000 Active 48 DOM
-
2026-06-09days on market $199,000 Active 47 DOM
-
2026-06-08days on market $199,000 Active 46 DOM
-
2026-06-07days on market $199,000 Active 45 DOM
-
2026-06-05days on market $199,000 Active 42 DOM
-
2026-06-03days on market $199,000 Active 41 DOM
-
2026-06-02days on market $199,000 Active 40 DOM
-
2026-06-01days on market $199,000 Active 39 DOM
-
2026-05-31days on market $199,000 Active 38 DOM
-
2026-05-30days on market $199,000 Active 37 DOM
-
2026-04-23$199,000 Active 409-char remark
-
2023-08-04price $176,000
-
2023-05-28$180,000 Active
ⓘ Source: listings_history table (triggers on properties + properties_extension) + one-shot
backfill from property_details.listing_events for pre-trigger history.
Tax reassessment forecast VA · Resets to sale price
- Current annual tax
- $979 · $82/mo
- Projected year-2 tax
- $1,632 · $136/mo
- Expected delta
- +$653/yr (+$54/mo · 66.7%)
ⓘ Screening estimate from a state-policy table — verify with the county assessor before closing.
Climate risk First Street
- Flood 9/10 Extreme FEMA zone X (unshaded) · 99% chance over 30 yrs
- Wildfire 4/10 Moderate
- Heat 4/10 Moderate 7 d/yr ≥98°F today · 19 d/yr by 30 yrs out
- Wind 2/10 Low 100% chance of damaging wind over 30 yrs
- Air quality 1/10 Low 0 unhealthy d/yr today · 0 by 30 yrs out
Nearby sold comps map
Loading sold comps map…
Walkable amenities ~0.75 mi
Loading nearby amenities…
Taxation est. · year 1
- Rental income
- $22,636
- − Mortgage interest
- −$11,147
- − Property taxes
- −$979
- − Insurance
- −$1,792
- − Repairs & maintenance
- −$1,811
- − Management
- −$1,811
- − Depreciation
- −$5,789
- Taxable loss
- −$693
- Est. tax savings @ 24.0%
- +$166
- After-tax cash flow
- $2,755/yr
For passive investors: Depreciation is non-cash, so a rental often shows a tax loss while cash-flowing — sheltering income. Rental losses are passive: they offset passive income freely, and up to $25,000/yr can offset ordinary (W-2) income if you actively participate and your MAGI is under $100k (phasing out to $0 by $150k); unused losses carry forward. On sale, claimed depreciation is recaptured at up to 25%, and gains may owe capital-gains tax (a 1031 exchange can defer both). Figures are a year-1 estimate at your 24.0% rate — not tax advice; consult a CPA.
Schools (NCES district)
- District
- Montgomery County Public School District
- NCES district ID
- 5102520
- Math proficiency
- 57% ▼ -29.00%
- Reading proficiency
- 70% ▼ -11.00%
- Median HH income
- $46,618
- Composite
- 53.6/100
- National rank
- #1440
- State rank
- #47 of 131 in VA
Livability — Shawsville
- Score
- 68/100
- State rank
- #273
- US rank
- #9807
Category grades
Schools grade is shown separately in the Schools card above.
Census & demographics
- Population (ZIP)
- 3,948
Population outlook (Montgomery County) Hauer SSP2
- Today (2025)
- 105,748 people
- By 2030
- 110,301 · +4.3%
- By 2040
- 115,652 · +9.4%
- By 2050
- 119,651 · +13.1%
- By 2075
- 126,005 · +19.2%
- By 2100
- 129,771 · +22.7%
Race, ethnicity, and origin ACS 2023
- Neighborhood character
- Predominantly White (78%)
- Race & ethnicity
- White 78% Hispanic / Latino 19% Two or more races 6% Black 3%
- Hispanic origin (detail)
- Mexican 15% Puerto Rican 3%
- Common ancestry
- Romanian 3% Italian 2% Serbian 2%
- Foreign-born
- 6% · Canada, China
- Languages at home
- 94% English-only · Spanish 6%
Political lean MEDSL · Montgomery
- 2024 margin
- Toss-up / Even · D 50.9% · R 47.4% · Other 1.7%
- 2008→2024 swing
- -1.4pp toward R · 2008: 4.9pp · 2024: 3.5pp
- All cycles
- 2024: D+3.5 2020: D+5.8 2016: D+1.3 2012: R+0.2 2008: D+4.9
Not yet ingested
- Civics
- —
Market trends
- HPI YoY
- ▲ 10.65%
- Current HPI
- 258.6535
- Rent YoY
- —
- Metro
- —
- State GDP YoY
- ▲ 2.40%
- F500 in state
- 50
Industry mix (Fortune 500 HQ in VA)
| Industry | F500 HQs | Revenue |
|---|---|---|
| Aerospace / Defense | 4 | $236B |
|
||
| Technology / Defense | 3 | $32B |
|
||
| Financial Services | 2 | $176B |
|
||
| Utilities | 2 | $27B |
|
||
| Insurance | 2 | $25B |
|
||
| Technology | 2 | $15B |
|
||
Price history
+10.6% since first listed3 events — show timeline
- 2026-04-23 Listed $199,000 NRVMLS
- 2023-08-04 Price Changed $176,000 NRVMLS
- 2023-05-28 Listed $180,000 NRVMLS
Property tax history
+2.1%/yrLatest (2025): $979 · +1.3% YoY. Source: county tax records.
Cash-flow waterfall
monthlySold comps — $/sqft
last 12 mo · ≤1 miLoading sold comps…