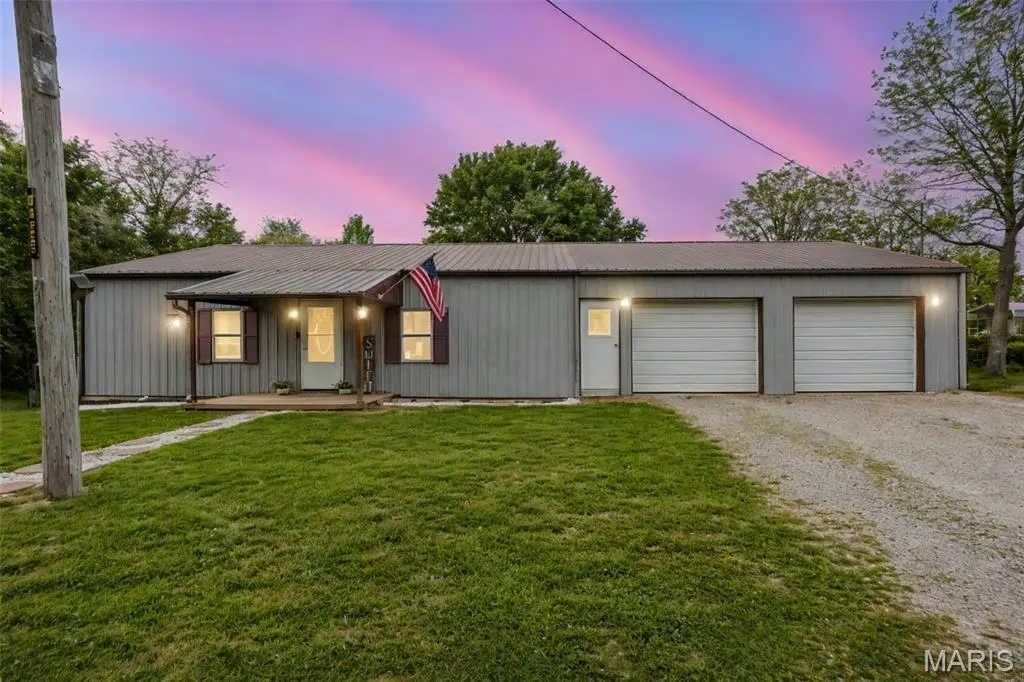
305 E North St
Mulberry Grove, IL 62262
$120,000D
1 bd · 1.0 ba ·
1,200 sqft ·
Built 2004
· SingleFamily
· Active
· 42 DOM
Cashflow @ list (25.0% down · 7.5%)
Estimated rent
$1,011/mo
Mortgage (P&I)
−$629
Tax + insurance
−$245
HOA
−$0
Vac / Maint / Mgmt
−$212
Net cashflow
$-76/mo
Annual
$-911/yr
Cap rate
5.53%
Cash-on-cash
-2.71%
DSCR
0.88
1% rule
0.84%
Cash to close
$33,600
Investor read
- This is a 1-bed/1.0-bath single-family listed at $120k.
- At list price, monthly cash flow is $-76 ($-911/yr) — negative.
- To cash-flow at today's rent, offer at most $107k (11.2% below list).
- To meet the 1% rule (rent ≥ 1% of price), the offer needs to be $101k (15.8% below list).
- It's been on market 42 days — a 3% lower offer ($116k) is reasonable based on typical stale-listing flexibility.
- Recommended offer: $101k (15.8% below list) — sets the bar for 1% rule.
- In year one you build about $5k of equity ($830 loan paydown + $4k appreciation (3.1% local appreciation)).
- Location reads 58/100 on livability (#1,127 in IL) — a working-class tenant base; expect higher turnover. Strengths: cost of living A+, housing A+; Watch: crime F, amenities F, commute F.
- Mulberry Grove CUSD 1 (rural): math 16% / reading 21% proficiency, ranked #732 of 919 in IL (top 80%) — low school quality limits family demand, transient renter base, plan for 1-2y turnover.
- Zoned schools: Mulberry Grove Elem School (math 17% / reading 27%, grade F, #940 of 2,056 statewide, top 49%, 165 students, 0% FRL); Mulberry Grove Jr High School (math 8% / reading 22%, grade F, #510 of 665 statewide, top 78%, 78 students, 0% FRL); Mulberry Grove Sr High School (math 10% / reading 10%, grade F, #528 of 693 statewide, top 82%, 111 students, 0% FRL) — zoned schools average 0% FRL vs 42% district-wide (42 pts lower); this property's tenant base skews higher-income than the district average.
- Market conditions: 7 active listings in the ZIP; 35 units permitted in Bond County in 2024 (0 in 5+ unit buildings).
- Bond County population projected at -23% by 2050 — secular population decline; favor cash flow + early exit over multi-decade hold.
- 2 sale attempts since 3y ago with the ask held roughly flat each time — persistent listings suggest the price (not the market) is what's stuck; bring a comps-based counter.
- At projected returns (3.1% appreciation + 3.0% rent growth), your $34k cash investment doubles in ~7 years — after that, you're playing with house money.
- By year 8, paydown + projected appreciation supports a ~$34k cash-out refi (75% LTV) — recoverable capital for the next deal without selling this one.
Questions for listing agent
- What do current leases actually rent for vs. the listed asking? Can we see a recent rent roll and the last 12 months of T-12 income?
- It's been on market 42 days. Have you received any prior offers? Is the seller open to a 16% concession, seller financing, or rate buy-down credit?
- Is there a deadline driving the sale (1031 exchange, divorce, estate, relocation)? That informs how much negotiation room exists.
- Schools are F-rated, which usually means shorter tenancies and higher turnover. Who's the typical renter profile here, and what's been the actual vacancy rate?
- Crime grade is F in this area — have there been break-ins, vandalism, or insurance claims at this property in the last 3 years? What carrier currently insures it and at what premium?
- The area grade is low — what's the realistic commute time and amenity access for the typical tenant pool here? Any planned neighborhood developments (good or bad) we should know about?
- What's the average days-on-market for RENTAL listings here right now (not sales)? A rising rental-DOM trend means longer vacancies and softer asking-rent achievability than the comps imply.
- What's the recent tenant-quality profile in this submarket — average credit score on applications, eviction rate, late-payment / NSF rate, and stable-employment percentage? A property-management company in the area should have these aggregated.
CashFlowRE · CFR-ZFWXGEE3PJ1JCB
· Data 2 weeks ago
cashflowre.app · 2026-05-29