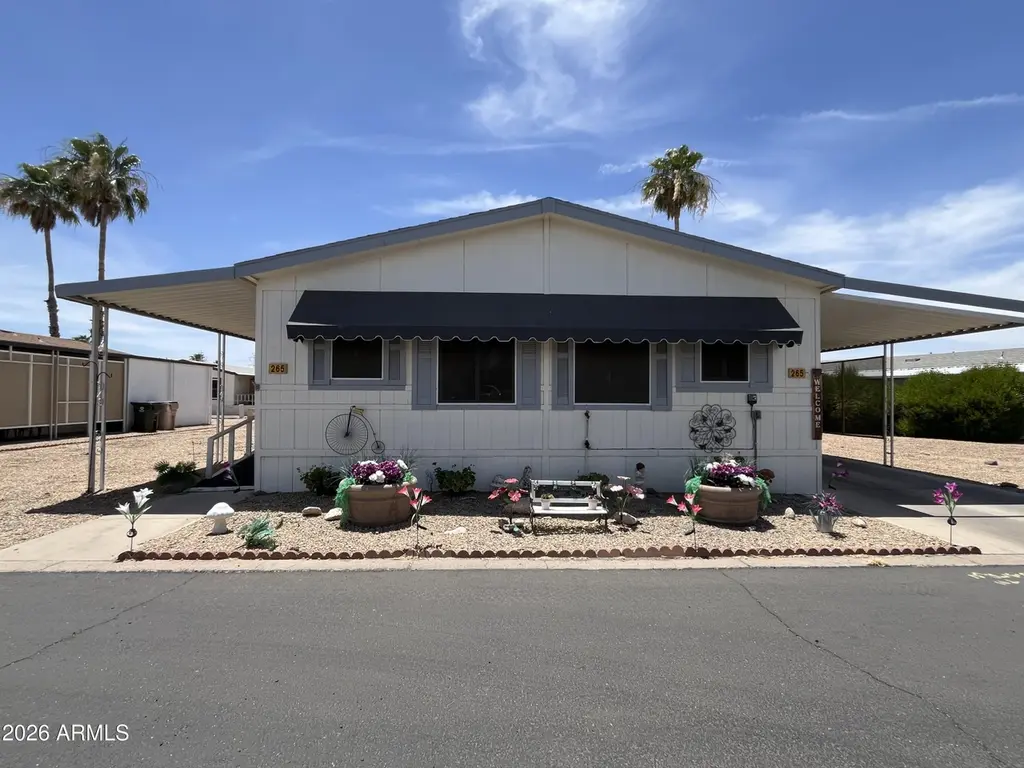
11596 W Sierra Dawn Blvd #265
Surprise, AZ 85378
$110,000A-
3 bd · 2.0 ba ·
1,904 sqft ·
Built 1994
· Manufactured
· Active
· 33 DOM
Cashflow @ list (25.0% down · 7.5%)
Estimated rent
$1,562/mo
Mortgage (P&I)
−$577
Tax + insurance
−$183
HOA
−$0
Vac / Maint / Mgmt
−$328
Net cashflow
$474/mo
Annual
$5,687/yr
Cap rate
11.46%
Cash-on-cash
18.46%
DSCR
1.82
1% rule
1.42%
Cash to close
$30,800
Investor read
- This is a 3-bed/2.0-bath manufactured listed at $110k. Condition is rated good.
- At list price, monthly cash flow is $474 ($6k/yr) — positive.
- The deal already cash-flows at list — no discount required.
- Meets the 1% rule at list price ($2k rent vs $110k).
- It's been on market 33 days — a 3% lower offer ($107k) is reasonable based on typical stale-listing flexibility.
- Recommended offer: $107k (3.0% below list) — sets the bar for market timing.
- In year one you build about $956 of equity ($761 loan paydown + $195 appreciation (0.2% local appreciation)).
- Location reads 74/100 on livability (#19 in AZ, #4,616 nationally) — a middle-class / working-renter tenant base. Strengths: crime A+, housing A+, employment A-; Watch: health & safety D+, amenities D-, commute F.
- Dysart Unified District (4243) (suburban): math 34% / reading 40% proficiency, ranked #73 of 249 in AZ (top 29%) — families likely to look elsewhere, expect single-tenant / working-renter base with shorter leases.
- Zoned schools: Thompson Ranch Elementary (math 17% / reading 24%, grade F, #729 of 1,109 statewide, top 67%, 716 students, 74% FRL); Valley Vista High School (math 25% / reading 32%, grade F, #133 of 381 statewide, top 35%, 2,464 students, 44% FRL) — zoned schools average 59% FRL vs 41% district-wide (18 pts higher); higher-poverty schools than district average — tighter screening recommended.
- Zoned-school proficiency averages 24% at this address vs 37% district-wide (-12 pts) — the specific schools serving this property underperform the Dysart Unified District (4243) average; the district grade overstates school quality for this exact location.
- Market conditions: Rents falling (-5.5%/yr); 80 active listings in the ZIP; 27 comparable units currently listed for rent nearby; rentals at typical pace (median 27d on market — plan ~3-4 weeks tenant-placement turnaround); 36,011 units permitted in Maricopa County in 2024 (12,801 in 5+ unit buildings).
- Maricopa County population projected at +38% by 2050 — long-run rental-demand tailwind backs the buy-and-hold thesis.
- At projected returns (0.2% appreciation + 0.0% rent growth), your $31k cash investment doubles in ~5 years — after that, you're playing with house money.
- Climate carrying-cost: extreme-heat days projected 7→16/yr by 2055 (HVAC capex compounding) — expect insurance premiums to compound above CPI over the hold.
- Cap rate 11.5% vs local median 3.3% in Surprise — top-decile yield for the area; either an underpriced asset or a hidden risk that comps aren't pricing in. Stress-test before assuming the spread holds.
- This rent runs 33% of the median local income ($56k/yr) — at the standard rent-burdened threshold; future hikes will face affordability resistance.
Questions for listing agent
- It's been on market 33 days. Have you received any prior offers? Is the seller open to a 3% concession, seller financing, or rate buy-down credit?
- Is there a deadline driving the sale (1031 exchange, divorce, estate, relocation)? That informs how much negotiation room exists.
- What's the average days-on-market for RENTAL listings here right now (not sales)? A rising rental-DOM trend means longer vacancies and softer asking-rent achievability than the comps imply.
- What's the recent tenant-quality profile in this submarket — average credit score on applications, eviction rate, late-payment / NSF rate, and stable-employment percentage? A property-management company in the area should have these aggregated.
- How much new for-sale + rental construction is in the pipeline within 1–3 miles? Heavy new supply typically softens prices + rents 12–24 months out; constrained supply supports both.
CashFlowRE · CFR-ZGNMJ06QGZZJZV
· Data 1 h ago
cashflowre.app · 2026-05-29