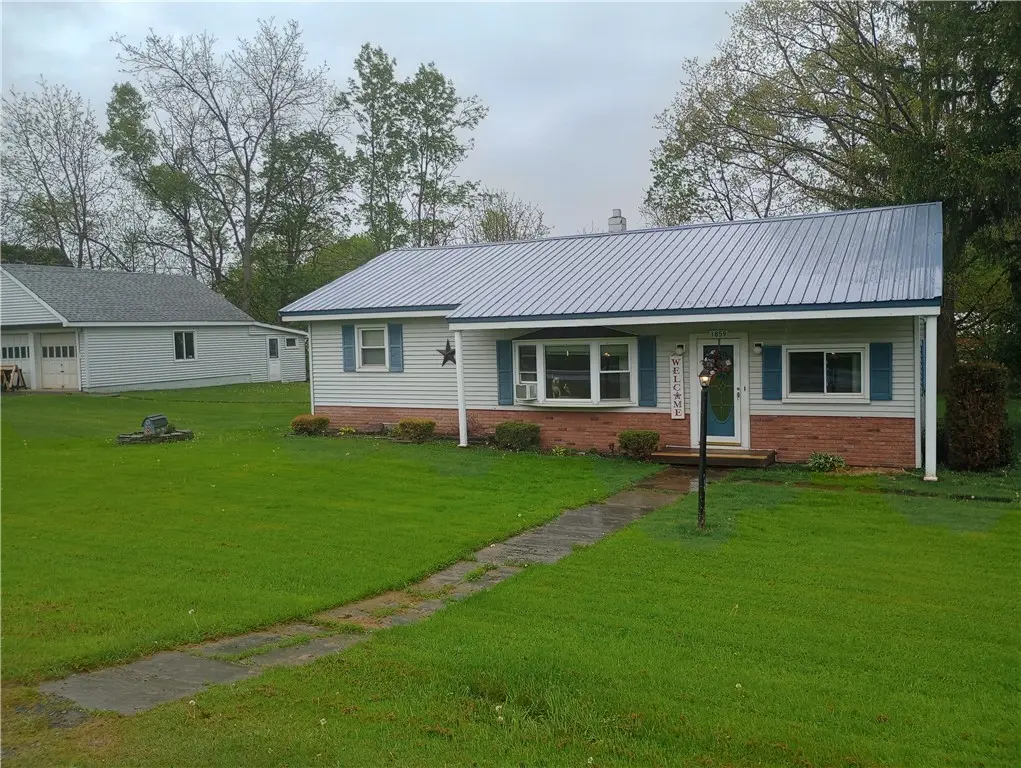
1859 State Highway 206
Sidney, NY 13804
$189,000D
3 bd · 1.0 ba ·
1,284 sqft ·
Built 1940
· SingleFamily
· Active
· 30 DOM
Cashflow @ list (25.0% down · 7.5%)
Estimated rent
$1,508/mo
Mortgage (P&I)
−$991
Tax + insurance
−$316
HOA
−$0
Vac / Maint / Mgmt
−$317
Net cashflow
$-115/mo
Annual
$-1,386/yr
Cap rate
5.56%
Cash-on-cash
-2.62%
DSCR
0.88
1% rule
0.80%
Cash to close
$52,920
Investor read
- This is a 3-bed/1.0-bath single-family listed at $189k.
- At list price, monthly cash flow is $-115 ($-1k/yr) — negative.
- To cash-flow at today's rent, offer at most $169k (10.8% below list).
- To meet the 1% rule (rent ≥ 1% of price), the offer needs to be $151k (20.2% below list).
- It's been on market 30 days — a 2% lower offer ($186k) is reasonable based on typical stale-listing flexibility.
- Recommended offer: $151k (20.2% below list) — sets the bar for 1% rule.
- In year one you build about $16k of equity ($1k loan paydown + $15k appreciation (7.9% local appreciation)).
- Location reads 69/100 on livability (#476 in NY) — a middle-class / working-renter tenant base. Strengths: cost of living A+, health & safety A+, housing A; Watch: employment D, amenities F, commute F.
- Sidney Central School District (town): math 44% / reading 47% proficiency, ranked #462 of 590 in NY (top 78%) — families likely to look elsewhere, expect single-tenant / working-renter base with shorter leases.
- Zoned schools: Sidney Elementary School (math 41% / reading 50%, grade D-, #1,271 of 2,108 statewide, top 60%, 527 students, 52% FRL); Sidney Middle School (math 32% / reading 42%, grade F, #448 of 729 statewide, top 63%, 171 students, 53% FRL); Sidney High School (math 92% / reading 75%, grade A, #409 of 1,100 statewide, top 39%, 336 students, 48% FRL).
- Watch-outs: built in 1940 — expect roof / HVAC / electrical / plumbing capex.
- Market conditions: 7 active listings in the ZIP; 66 units permitted in Delaware County in 2024 (0 in 5+ unit buildings).
- Delaware County population projected at -27% by 2050 — secular population decline; favor cash flow + early exit over multi-decade hold.
- 2 sale attempts since 5y ago with the ask held roughly flat each time — persistent listings suggest the price (not the market) is what's stuck; bring a comps-based counter.
- Current owner paid $123k; list at $189k implies a 54% gain — meaningful room to come down on a strong offer.
- By year 3, paydown + projected appreciation supports a ~$40k cash-out refi (75% LTV) — recoverable capital for the next deal without selling this one.
- Climate carrying-cost: major flood risk — expect insurance premiums to compound above CPI over the hold.
Questions for listing agent
- What do current leases actually rent for vs. the listed asking? Can we see a recent rent roll and the last 12 months of T-12 income?
- Built in 1940 — when were the roof, HVAC, electrical panel, plumbing, and water heater last replaced?
- Is there a deadline driving the sale (1031 exchange, divorce, estate, relocation)? That informs how much negotiation room exists.
- Schools are D-rated, which usually means shorter tenancies and higher turnover. Who's the typical renter profile here, and what's been the actual vacancy rate?
- The area grade is low — what's the realistic commute time and amenity access for the typical tenant pool here? Any planned neighborhood developments (good or bad) we should know about?
- What's the average days-on-market for RENTAL listings here right now (not sales)? A rising rental-DOM trend means longer vacancies and softer asking-rent achievability than the comps imply.
- What's the recent tenant-quality profile in this submarket — average credit score on applications, eviction rate, late-payment / NSF rate, and stable-employment percentage? A property-management company in the area should have these aggregated.
- How much new for-sale + rental construction is in the pipeline within 1–3 miles? Heavy new supply typically softens prices + rents 12–24 months out; constrained supply supports both.
CashFlowRE · CFR-ZGYMAG8XMSA86W
· Data 23 min ago
cashflowre.app · 2026-05-29