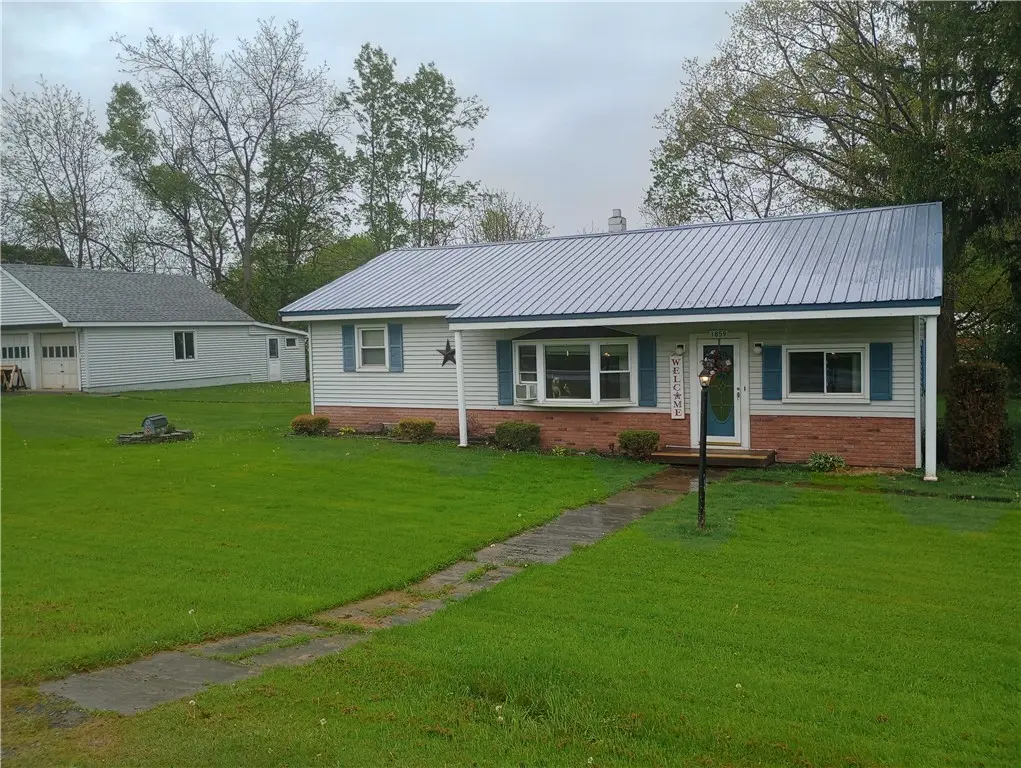
1859 State Highway 206 · Sidney, NY
Flood risk 6/10 · Moderate
- FEMA flood zone
- X (unshaded)
- Chance of flooding over 30 yrs
- 0.49%
- Est. flood insurance / yr
- $473 – $860
Fire risk 2/10 · Minimal
- Est. fire insurance / yr
- $691 – $1,283
Heat risk 2/10 · Minimal
- Hot days now (above 90°F)
- 8 days/yr
- Hot days in 30 yrs
- 18 days/yr
Wind risk 2/10 · Minimal
- Chance of severe wind over 30 yrs
- 1.0%
Air-quality risk 2/10 · Minimal
- Unhealthy air days now
- 0 days/yr
- Unhealthy air days in 30 yrs
- 1 days/yr
Risk factors via First Street. Map © Google.
Why this score? — see what drove the D grade
The composite is a weighted blend of 9 inputs, each scored 0–100. Each bar is that input's sub-score; the figure is the points it added to the 100-point composite (weight × sub-score).
- Cash flow +10.0/30.0
- Appreciation +8.9/10.0
- ARV discount +7.5/15.0
- Schools +3.8/10.0
- Livability +3.5/5.0
- 1% rule +3.0/10.0
- DSCR +2.8/10.0
- Rent growth +2.5/5.0
- Condition / age +2.5/5.0
$189,000
🖨 Deal sheet (PDF) 📄 Offer letter ✓ Due diligence
Listing remarks MLS
Best Bargain For Miles! And nice looking too! Handsome ranch is complete will all of the work done. Large lot, beautiful setting, with woodworking shop off the garage. Very do-able at just $129,900.00!
Key facts
- Easy commute
- Covered patio
- 0.5 acre lot
Tags
Property features AI
Exterior
- Parking: Detached garage; 2-car garage
- Utilities: Well water; Septic tank
- Home design: Single-story home; Existing/resale property
- Construction: Aluminum siding; Vinyl siding; Block and stone foundation
- Exterior features: Blacktop driveway; Irregular lot; Main thoroughfare frontage; Lot dimensions approximately 191 x 146
Interior
- Kitchen: Electric cooktop; Refrigerator
- Bedrooms: 3 main-level bedrooms
- Flooring: Carpet; Laminate; Varied flooring
- Bathrooms: 1 full bathroom (main level)
- Heating & cooling: Oil-fired forced air heating
- Interior features: Country kitchen; Full basement; Fireplace (1)
- Laundry & utility: Main-level laundry; Oil water heater
Neighborhood map
What this means for you Summary
Snapshot
- This is a 3-bed/1.0-bath single-family listed at $189k.
Deal economics
- At list price, monthly cash flow is $-115 ($-1k/yr) — negative.
- To cash-flow at today's rent, offer at most $169k (10.8% below list).
- To meet the 1% rule (rent ≥ 1% of price), the offer needs to be $151k (20.2% below list).
- Recommended offer: $151k (20.2% below list) — sets the bar for 1% rule.
Location & tenants
- Location reads 69/100 on livability (#476 in NY) — a middle-class / working-renter tenant base. Strengths: cost of living A+, health & safety A+, housing A; Watch: employment D, amenities F, commute F.
- Sidney Central School District (town): math 44% / reading 47% proficiency, ranked #462 of 590 in NY (top 78%) — families likely to look elsewhere, expect single-tenant / working-renter base with shorter leases.
- Zoned schools: Sidney Elementary School (math 41% / reading 50%, grade D-, #1,271 of 2,108 statewide, top 60%, 527 students, 52% FRL); Sidney Middle School (math 32% / reading 42%, grade F, #448 of 729 statewide, top 63%, 171 students, 53% FRL); Sidney High School (math 92% / reading 75%, grade A, #409 of 1,100 statewide, top 39%, 336 students, 48% FRL).
- Market conditions: 7 active listings in the ZIP; 66 units permitted in Delaware County in 2024 (0 in 5+ unit buildings).
Forward outlook
- In year one you build about $16k of equity ($1k loan paydown + $15k appreciation (7.9% local appreciation)).
- Delaware County population projected at -27% by 2050 — secular population decline; favor cash flow + early exit over multi-decade hold.
- By year 3, paydown + projected appreciation supports a ~$40k cash-out refi (75% LTV) — recoverable capital for the next deal without selling this one.
Negotiation context
- It's been on market 29 days — a 2% lower offer ($186k) is reasonable based on typical stale-listing flexibility.
- 2 sale attempts since 5y ago with the ask held roughly flat each time — persistent listings suggest the price (not the market) is what's stuck; bring a comps-based counter.
- Current owner paid $123k; list at $189k implies a 54% gain — meaningful room to come down on a strong offer.
Risks & watch-outs
- Watch-outs: built in 1940 — expect roof / HVAC / electrical / plumbing capex.
- Climate carrying-cost: major flood risk — expect insurance premiums to compound above CPI over the hold.
Questions for the listing agent
- What do current leases actually rent for vs. the listed asking? Can we see a recent rent roll and the last 12 months of T-12 income?
- Built in 1940 — when were the roof, HVAC, electrical panel, plumbing, and water heater last replaced?
- Is there a deadline driving the sale (1031 exchange, divorce, estate, relocation)? That informs how much negotiation room exists.
- Schools are D-rated, which usually means shorter tenancies and higher turnover. Who's the typical renter profile here, and what's been the actual vacancy rate?
- The area grade is low — what's the realistic commute time and amenity access for the typical tenant pool here? Any planned neighborhood developments (good or bad) we should know about?
- What's the average days-on-market for RENTAL listings here right now (not sales)? A rising rental-DOM trend means longer vacancies and softer asking-rent achievability than the comps imply.
- What's the recent tenant-quality profile in this submarket — average credit score on applications, eviction rate, late-payment / NSF rate, and stable-employment percentage? A property-management company in the area should have these aggregated.
- How much new for-sale + rental construction is in the pipeline within 1–3 miles? Heavy new supply typically softens prices + rents 12–24 months out; constrained supply supports both.
Investment metrics
- 1% rule
- 0.80% ✗
- Cap rate
- 5.56%
- Cash-on-cash
- -2.62%
- DSCR
- 0.88
- GRM
- 10.4
CMA / ARV
No comps found within radius.
Projected returns pro-forma
7.86% appreciation · 3.0% rent growth · sell at horizon
- IRR
- 17.7%
- Equity multiple
- 2.30×
- Total profit
- $68,830
- Equity at exit
- $141,785
- IRR
- 16.8%
- Equity multiple
- 4.88×
- Total profit
- $205,163
- Equity at exit
- $279,739
Cash invested: $52,920 (down + closing). Projections, not guarantees.
Landlord ↔ Tenant lean methodology
- Overall (STATE)
- 15 Strongly Tenant-Friendly
- State New York
- 15 Strongly Tenant-Friendly · D+10
- County
- — inherits STATE
- City
- — inherits STATE
ZIP-level market 13804
- Home prices YoY
- 2.4%
- Active inventory
- 7
- Price-to-rent
- 10.4×
Monthly cashflow live
- Estimated rent
- $1,508 medium interval (Pro) →
- Mortgage (P&I)
- −$991
- Tax from tax record
- −$237 /mo · $2,846/yr
- Insurance
- −$79
- HOA
- −$0
- Vacancy / Maint / Mgmt
- −$317
- Net cashflow
- $-115
Break-even live
Sensitivity live
| Price | -10% $-9 | -5% $-62 | +0% $-115 | +5% $-169 | +10% $-222 |
|---|---|---|---|---|---|
| Rent | -10% $-235 | -5% $-175 | +0% $-115 | +5% $-56 | +10% $4 |
| Rate | -1.0pp $-20 | -0.5pp $-67 | base $-115 | +0.5pp $-164 | +1.0pp $-214 |
UW: 25.0% down · 7.5% · 30yr · 1.5% tax · 5.0% vac · 8.0% maint · 8.0% mgmt
Financing live
Cash to close
- Down payment
- $47,250
- Closing costs
- $5,670
- Reserves months
- —
- Total cash needed
- —
Loan-product check · same deal, 3 products live
Conventional
25% down · 7.5% · 30yr
- Down + closing
- —
- Monthly P&I
- —
- Monthly cashflow
- —
- DSCR
- —
- Eligible?
- —
Personal DTI + credit; lowest rate.
DSCR
20% down · 8.5% · 30yr
- Down + closing
- —
- Monthly P&I
- —
- Monthly cashflow
- —
- DSCR
- —
- Eligible?
- —
No personal income docs; deal must DSCR.
Hard money
10% down · 12.0% · 12mo
- Down + closing
- —
- Monthly P&I
- —
- Monthly cashflow
- —
- DSCR
- —
- Eligible?
- —
Short-term bridge; refi at stabilization.
Listing history 21 events
-
2026-06-21days on market $189,000 Active 29 DOM
-
2026-06-21days on market $189,000 Active 28 DOM
-
2026-06-18price $189,000 Active 26 DOM
-
2026-06-18days on market $198,000 Active 26 DOM
-
2026-06-17days on market $198,000 Active 25 DOM
-
2026-06-16days on market $198,000 Active 24 DOM
-
2026-06-15days on market $198,000 Active 23 DOM
-
2026-06-13days on market $198,000 Active 21 DOM
-
2026-06-12days on market $198,000 Active 20 DOM
-
2026-06-09days on market $198,000 Active 17 DOM
-
2026-06-08days on market $198,000 Active 16 DOM
-
2026-06-07days on market $198,000 Active 15 DOM
-
2026-06-07days on market $198,000 Active 14 DOM
-
2026-06-04days on market $198,000 Active 11 DOM
-
2026-06-02days on market $198,000 Active 10 DOM
-
2026-06-01days on market $198,000 Active 9 DOM
-
2026-05-31days on market $198,000 Active 8 DOM
-
2026-05-23$198,000 Active
-
2022-04-05soldstatus $123,000
-
2022-02-17soldstatus $123,000 201-char remark
Show marketing remark (201 chars)
Best Bargain For Miles! And nice looking too! Handsome ranch is complete will all of the work done. Large lot, beautiful setting, with woodworking shop off the garage. Very do-able at just $129,900.00!
-
2021-08-09$129,900 201-char remark
Show marketing remark (201 chars)
Best Bargain For Miles! And nice looking too! Handsome ranch is complete will all of the work done. Large lot, beautiful setting, with woodworking shop off the garage. Very do-able at just $129,900.00!
ⓘ Source: listings_history table (triggers on properties + properties_extension) + one-shot
backfill from property_details.listing_events for pre-trigger history.
Tax reassessment forecast NY · Partial reset (capped growth)
- Current annual tax
- $2,846 · $237/mo
- Projected year-2 tax
- $3,020 · $252/mo
- Expected delta
- +$174/yr (+$14/mo · 6.1%)
ⓘ Screening estimate from a state-policy table — verify with the county assessor before closing.
Climate risk First Street
- Flood 6/10 Major FEMA zone X (unshaded) · 49% chance over 30 yrs
- Wildfire 2/10 Low
- Heat 2/10 Low 8 d/yr ≥90°F today · 18 d/yr by 30 yrs out
- Wind 2/10 Low 100% chance of damaging wind over 30 yrs
- Air quality 2/10 Low 0 unhealthy d/yr today · 1 by 30 yrs out
Nearby sold comps map
Loading sold comps map…
Walkable amenities ~0.75 mi
Loading nearby amenities…
Taxation est. · year 1
- Rental income
- $18,100
- − Mortgage interest
- −$10,587
- − Property taxes
- −$2,846
- − Insurance
- −$945
- − Repairs & maintenance
- −$1,448
- − Management
- −$1,448
- − Depreciation
- −$5,498
- Taxable loss
- −$4,672
- Est. tax savings @ 24.0%
- +$1,121
- After-tax cash flow
- $-265/yr
For passive investors: Depreciation is non-cash, so a rental often shows a tax loss while cash-flowing — sheltering income. Rental losses are passive: they offset passive income freely, and up to $25,000/yr can offset ordinary (W-2) income if you actively participate and your MAGI is under $100k (phasing out to $0 by $150k); unused losses carry forward. On sale, claimed depreciation is recaptured at up to 25%, and gains may owe capital-gains tax (a 1031 exchange can defer both). Figures are a year-1 estimate at your 24.0% rate — not tax advice; consult a CPA.
Schools (NCES district)
- District
- Sidney Central School District
- NCES district ID
- 3626850
- Math proficiency
- 44% ▼ -2.00%
- Reading proficiency
- 47% ▲ 5.00%
- Median HH income
- $42,110
- Composite
- 38.29/100
- National rank
- #4232
- State rank
- #462 of 590 in NY
Livability — Sidney
- Score
- 69/100
- State rank
- #476
- US rank
- #8397
Category grades
Schools grade is shown separately in the Schools card above.
Census & demographics
- Population (ZIP)
- 266
Population outlook (Delaware County) Hauer SSP2
- Today (2025)
- 42,668 people
- By 2030
- 40,337 · -5.5%
- By 2040
- 35,514 · -16.8%
- By 2050
- 31,265 · -26.7%
- By 2075
- 24,455 · -42.7%
- By 2100
- 19,529 · -54.2%
Race, ethnicity, and origin ACS 2023
- Neighborhood character
- Predominantly White (100%)
- Race & ethnicity
- White 100%
- Common ancestry
- Portuguese 2% Romanian 1% Slovak 1%
Political lean MEDSL · Delaware
- 2024 margin
- R (+19.8) · D 40.1% · R 59.9%
- 2008→2024 swing
- -14.6pp toward R · 2008: -5.2pp · 2024: -19.8pp
- All cycles
- 2024: R+19.8 2020: R+18.4 2016: R+29.2 2012: R+9.6 2008: R+5.2
Not yet ingested
- Civics
- —
Market trends
- HPI YoY
- ▲ 7.86%
- Current HPI
- 335.3024
- Rent YoY
- —
- Metro
- —
- State GDP YoY
- ▲ 2.60%
- F500 in state
- 92
Industry mix (Fortune 500 HQ in NY)
| Industry | F500 HQs | Revenue |
|---|---|---|
| Financial Services | 10 | $950B |
|
||
| Consumer Goods | 9 | $162B |
|
||
| Insurance | 4 | $225B |
|
||
| Telecommunications | 2 | $144B |
|
||
| Pharmaceuticals | 2 | $112B |
|
||
| Media / Entertainment | 2 | $69B |
|
||
Price history
+52.4% since first listed4 events — show timeline
- 2026-05-23 Listed $198,000 UNYREIS
- 2022-04-05 Sold (Public Records) $123,000 Public Records
- 2022-02-17 Sold (MLS) $123,000 ODBOR
- 2021-08-09 Listed $129,900 ODBOR
Property tax history
+6.7%/yrLatest (2025): $2,846 · +0.2% YoY. Source: county tax records.
Cash-flow waterfall
monthlySold comps — $/sqft
last 12 mo · ≤1 miLoading sold comps…