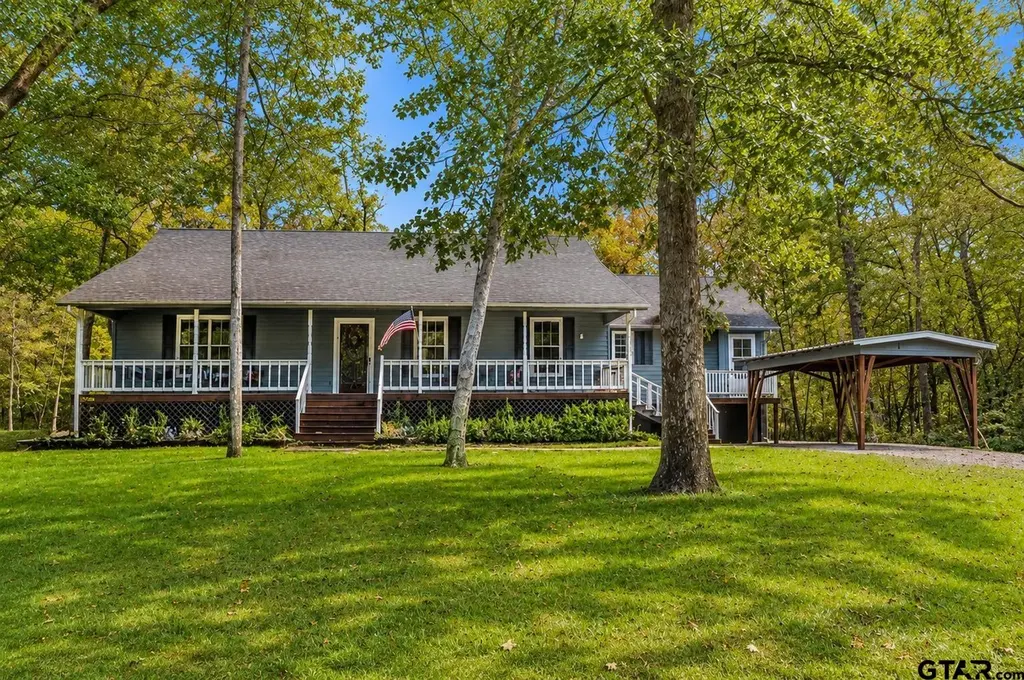
109 King Lyle Rd
Mount Vernon, TX 75480
$299,000B
2 bd · 1.0 ba ·
1,480 sqft ·
Built 1996
· SingleFamily
· Active
· 40 DOM
Cashflow @ list (25.0% down · 7.5%)
Estimated rent
$3,450/mo
Mortgage (P&I)
−$1,568
Tax + insurance
−$417
HOA
−$89
Vac / Maint / Mgmt
−$724
Net cashflow
$651/mo
Annual
$7,815/yr
Cap rate
8.91%
Cash-on-cash
9.33%
DSCR
1.42
1% rule
1.15%
Cash to close
$83,720
Investor read
- This is a 2-bed/1.0-bath single-family listed at $299k.
- At list price, monthly cash flow is $651 ($8k/yr) — positive.
- The deal already cash-flows at list — no discount required.
- Meets the 1% rule at list price ($3k rent vs $299k).
- It's been on market 40 days — a 3% lower offer ($290k) is reasonable based on typical stale-listing flexibility.
- Recommended offer: $290k (3.0% below list) — sets the bar for market timing.
- In year one you build about $17k of equity ($2k loan paydown + $15k appreciation (5.1% local appreciation)).
- Location reads 74/100 on livability (#190 in TX, #4,869 nationally) — a middle-class / working-renter tenant base. Strengths: cost of living A+, housing A+, health & safety A+; Watch: employment D+, amenities F, commute F.
- Mount Vernon ISD (town): math 49% / reading 43% proficiency, ranked #251 of 826 in TX (top 30%) — families likely to look elsewhere, expect single-tenant / working-renter base with shorter leases.
- Zoned schools: Mt Vernon El (math 47% / reading 40%, grade F, #1,269 of 4,322 statewide, top 30%, 610 students, 70% FRL); Mt Vernon Middle (math 52% / reading 43%, grade C-, #408 of 1,662 statewide, top 25%, 472 students, 72% FRL); Mt Vernon H S (math 42% / reading 52%, grade D-, #591 of 1,632 statewide, top 38%, 489 students, 63% FRL) — zoned schools average 68% FRL vs 52% district-wide (17 pts higher); higher-poverty schools than district average — tighter screening recommended.
- Market conditions: 98 active listings in the ZIP; 1 comparable units currently listed for rent nearby; 7 units permitted in Franklin County in 2024 (0 in 5+ unit buildings).
- 4 sale attempts since 7y ago; this cycle's ask has dropped $21k (7%) from the opening price — seller is motivated, your offer sets the floor, not the list.
- At projected returns (5.1% appreciation + 3.0% rent growth), your $84k cash investment doubles in ~4 years — after that, you're playing with house money.
- By year 3, paydown + projected appreciation supports a ~$43k cash-out refi (75% LTV) — recoverable capital for the next deal without selling this one.
- Climate carrying-cost: major wind risk, 27% chance of damaging wind over 30y; extreme-heat days projected 7→24/yr by 2055 (HVAC capex compounding) — expect insurance premiums to compound above CPI over the hold.
- Cap rate 8.9% vs local median 1.7% in Mount Vernon — top-decile yield for the area; either an underpriced asset or a hidden risk that comps aren't pricing in. Stress-test before assuming the spread holds.
Questions for listing agent
- It's been on market 40 days. Have you received any prior offers? Is the seller open to a 3% concession, seller financing, or rate buy-down credit?
- What does the HOA fee cover, when was the last increase, and are there any pending special assessments or reserve-fund shortfalls?
- Is there a deadline driving the sale (1031 exchange, divorce, estate, relocation)? That informs how much negotiation room exists.
- What's the average days-on-market for RENTAL listings here right now (not sales)? A rising rental-DOM trend means longer vacancies and softer asking-rent achievability than the comps imply.
- What's the recent tenant-quality profile in this submarket — average credit score on applications, eviction rate, late-payment / NSF rate, and stable-employment percentage? A property-management company in the area should have these aggregated.
- How much new for-sale + rental construction is in the pipeline within 1–3 miles? Heavy new supply typically softens prices + rents 12–24 months out; constrained supply supports both.
CashFlowRE · CFR-ZHYM4A35S1ZFKM
· Data 19 h ago
cashflowre.app · 2026-05-29