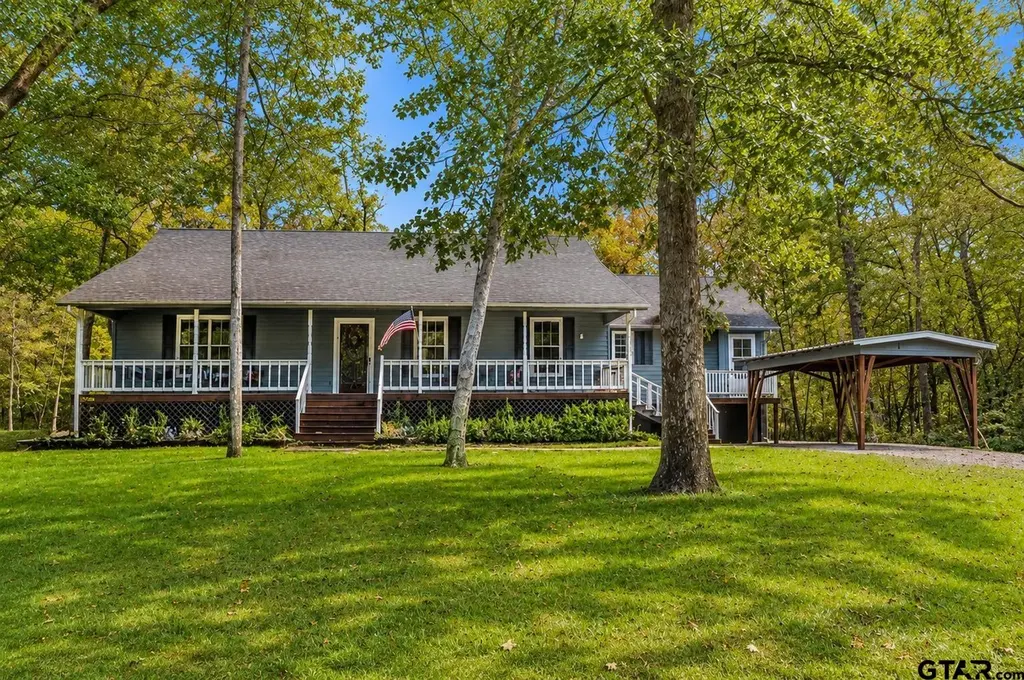
109 King Lyle Rd · Mount Vernon, TX
Flood risk 1/10 · Minimal
- FEMA flood zone
- —
- Chance of flooding over 30 yrs
- 0.0%
- Est. flood insurance / yr
- —
Fire risk 3/10 · Minor
- Est. fire insurance / yr
- $1,222 – $2,270
Heat risk 7/10 · Major
- Hot days now (above 110°F)
- 7 days/yr
- Hot days in 30 yrs
- 24 days/yr
Wind risk 6/10 · Moderate
- Chance of severe wind over 30 yrs
- 27.0%
Air-quality risk 2/10 · Minimal
- Unhealthy air days now
- 0 days/yr
- Unhealthy air days in 30 yrs
- 1 days/yr
Risk factors via First Street. Map © Google.
Why this score? — see what drove the B grade
The composite is a weighted blend of 9 inputs, each scored 0–100. Each bar is that input's sub-score; the figure is the points it added to the 100-point composite (weight × sub-score).
- Cash flow +25.0/30.0
- ARV discount +15.0/15.0
- DSCR +8.2/10.0
- Appreciation +7.6/10.0
- 1% rule +6.5/10.0
- Schools +3.9/10.0
- Livability +3.7/5.0
- Rent growth +2.5/5.0
- Condition / age +2.5/5.0
$299,000
🖨 Deal sheet (PDF) 📄 Offer letter ✓ Due diligence
Listing remarks
STUNNING LAKE CYPRESS SPRINGS COTTAGE: A PEACEFUL LAKESIDE RETREAT IN GATED KINGS COUNTRY Experience the ultimate East Texas escape in this charming 2-bedroom, 2-bathroom cottage nestled within the prestigious Kings Country subdivision, a premier gated lakeside community on Lake Cypress Springs. Combining comfort with total reliability, this home features serene water views and a built-in Generac generator for the ultimate peace of mind. Interior Excellence & Smart Design Accessible Living: Functional single-level, split-primary floor plan designed for privacy and ease of movement. Cozy Ambience: An inviting kitchen/dining combo flows into a living area anchored by a wood-burning stov
Key facts
- Built-in generator
- Screened-in porch
- Lake views
Tags
Property features AI
Finance
- Other: Subdivision: KINGS COUNTRY
- HOA & community: Homeowners association with quarterly fee; Quarterly association fee of $267 (approximately $89/month); Gated community; Tennis courts
Exterior
- Parking: Gravel parking
- Security: Smoke detectors
- Utilities: Cable available; Water frontage on Cypress Springs
- Home design: Single-family detached residence; One story
- Construction: Composition roof
- Exterior features: Porch (screened); Storm doors; Storage; Workshop; Has view
Interior
- Kitchen: Dishwasher; Double oven; Electric oven; Electric range; Refrigerator; Gas cooktop; Gas oven; Gas range; Microwave; Disposal
- Flooring: Carpet; Laminate; Wood
- Bathrooms: 2 full bathrooms
- Heating & cooling: Central heating; Electric heating; Space heater; Wood stove; Central air; Attic fan; Ceiling fans
- Interior features: Walk-in closets; Pantry
Neighborhood map
What this means for you Summary
Snapshot
- This is a 2-bed/1.0-bath single-family listed at $299k.
Deal economics
- At list price, monthly cash flow is $651 ($8k/yr) — positive.
- The deal already cash-flows at list — no discount required.
- Meets the 1% rule at list price ($3k rent vs $299k).
- Recommended offer: $290k (3.0% below list) — sets the bar for market timing.
- Cap rate 8.9% vs local median 1.7% in Mount Vernon — top-decile yield for the area; either an underpriced asset or a hidden risk that comps aren't pricing in. Stress-test before assuming the spread holds.
Location & tenants
- Location reads 74/100 on livability (#190 in TX, #4,869 nationally) — a middle-class / working-renter tenant base. Strengths: cost of living A+, housing A+, health & safety A+; Watch: employment D+, amenities F, commute F.
- Mount Vernon ISD (town): math 49% / reading 43% proficiency, ranked #251 of 826 in TX (top 30%) — families likely to look elsewhere, expect single-tenant / working-renter base with shorter leases.
- Zoned schools: Mt Vernon El (math 47% / reading 40%, grade F, #1,269 of 4,322 statewide, top 30%, 610 students, 70% FRL); Mt Vernon Middle (math 52% / reading 43%, grade C-, #408 of 1,662 statewide, top 25%, 472 students, 72% FRL); Mt Vernon H S (math 42% / reading 52%, grade D-, #591 of 1,632 statewide, top 38%, 489 students, 63% FRL) — zoned schools average 68% FRL vs 52% district-wide (17 pts higher); higher-poverty schools than district average — tighter screening recommended.
- Market conditions: 98 active listings in the ZIP; 1 comparable units currently listed for rent nearby; 7 units permitted in Franklin County in 2024 (0 in 5+ unit buildings).
Forward outlook
- In year one you build about $17k of equity ($2k loan paydown + $15k appreciation (5.1% local appreciation)).
- At projected returns (5.1% appreciation + 3.0% rent growth), your $84k cash investment doubles in ~4 years — after that, you're playing with house money.
- By year 3, paydown + projected appreciation supports a ~$43k cash-out refi (75% LTV) — recoverable capital for the next deal without selling this one.
Negotiation context
- It's been on market 40 days — a 3% lower offer ($290k) is reasonable based on typical stale-listing flexibility.
- 4 sale attempts since 7y ago; this cycle's ask has dropped $21k (7%) from the opening price — seller is motivated, your offer sets the floor, not the list.
Risks & watch-outs
- Climate carrying-cost: major wind risk, 27% chance of damaging wind over 30y; extreme-heat days projected 7→24/yr by 2055 (HVAC capex compounding) — expect insurance premiums to compound above CPI over the hold.
Questions for the listing agent
- It's been on market 40 days. Have you received any prior offers? Is the seller open to a 3% concession, seller financing, or rate buy-down credit?
- What does the HOA fee cover, when was the last increase, and are there any pending special assessments or reserve-fund shortfalls?
- Is there a deadline driving the sale (1031 exchange, divorce, estate, relocation)? That informs how much negotiation room exists.
- What's the average days-on-market for RENTAL listings here right now (not sales)? A rising rental-DOM trend means longer vacancies and softer asking-rent achievability than the comps imply.
- What's the recent tenant-quality profile in this submarket — average credit score on applications, eviction rate, late-payment / NSF rate, and stable-employment percentage? A property-management company in the area should have these aggregated.
- How much new for-sale + rental construction is in the pipeline within 1–3 miles? Heavy new supply typically softens prices + rents 12–24 months out; constrained supply supports both.
Investment metrics
- 1% rule
- 1.15% ✓
- Cap rate
- 8.91%
- Cash-on-cash
- 9.33%
- DSCR
- 1.42
- GRM
- 7.2
CMA / ARV
- ARV (median comp)
- $524,892
- List price
- $299,000
- Delta
- -43.04%
- Verdict
- UNDERPRICED
- Comps
- 20 within 1.0 mi
Show comp detail 11 sales within ~0.75 mi
| Address | Dist | Beds/Ba | Sqft | Sold | Price | $/sf | Match |
|---|---|---|---|---|---|---|---|
| 814 King Lake Dr | 0.06mi | 3/1.0 (+1) | 1,270 (-14%) | 7mo | $219,900 | $173 | 62 |
| 108 King Victor Rd | 0.34mi | 2/2.5 | 1,447 (-2%) | 15mo | $299,000 | $207 | 62 |
| 708 King John Blvd | 0.40mi | 3/2.0 (+1) | 1,516 (+2%) | 14mo | $305,000 | $201 | 57 |
| 111 King James | 0.47mi | 3/2.5 (+1) | 1,427 (-4%) | 5mo | $275,000 | $193 | 56 |
| 207 King Victor Rd | 0.42mi | 3/3.0 (+1) | 1,503 (+2%) | 14mo | $199,000 | $132 | 53 |
| 106 King Lyle Rd | 0.12mi | 3/2.0 (+1) | 1,628 (+10%) | 23mo | $699,900 | $430 | 50 |
| 504 Kings Country Blvd Blvd | 0.71mi | 3/2.0 (+1) | 1,516 (+2%) | 9mo | $339,500 | $224 | 47 |
| 814 King Leonard Ct | 0.21mi | 3/2.0 (+1) | 1,612 (+9%) | 24mo | $699,900 | $434 | 46 |
| 171 King Andrew Ct | 0.68mi | 3/2.0 (+1) | 1,600 (+8%) | 2mo | $395,000 | $247 | 44 |
| 508 Kings Country Blvd | 0.70mi | 3/2.0 (+1) | 1,516 (+2%) | 14mo | $339,500 | $224 | 43 |
| 192 King Andrew Ct | 0.73mi | 3/2.0 (+1) | 1,600 (+8%) | 8mo | $295,000 | $184 | 37 |
Match score weights: distance 35% · size 25% · config 20% · recency 20%. Top-matched comps best support the ARV.
Projected returns pro-forma
5.13% appreciation · 3.0% rent growth · sell at horizon
- IRR
- 21.2%
- Equity multiple
- 2.35×
- Total profit
- $112,609
- Equity at exit
- $171,737
- IRR
- 20.8%
- Equity multiple
- 4.63×
- Total profit
- $303,730
- Equity at exit
- $298,311
Cash invested: $83,720 (down + closing). Projections, not guarantees.
Landlord ↔ Tenant lean methodology
- Overall (STATE)
- 87 Strongly Landlord-Friendly
- State Texas
- 87 Strongly Landlord-Friendly · R+5
- County
- — inherits STATE
- City
- — inherits STATE
ZIP-level market 75480
- Home prices YoY
- 2.2%
- Active inventory
- 98
- Price-to-rent
- 7.2×
Monthly cashflow live
- Estimated rent
- $3,450 medium interval (Pro) →
- Mortgage (P&I)
- −$1,568
- Tax from tax record
- −$293 /mo · $3,512/yr
- Insurance
- −$125
- HOA
- −$89
- Vacancy / Maint / Mgmt
- −$724
- Net cashflow
- $651
Break-even live
Sensitivity live
| Price | -10% $820 | -5% $736 | +0% $651 | +5% $567 | +10% $482 |
|---|---|---|---|---|---|
| Rent | -10% $379 | -5% $515 | +0% $651 | +5% $788 | +10% $924 |
| Rate | -1.0pp $802 | -0.5pp $727 | base $651 | +0.5pp $574 | +1.0pp $495 |
UW: 25.0% down · 7.5% · 30yr · 1.5% tax · 5.0% vac · 8.0% maint · 8.0% mgmt
Financing live
Cash to close
- Down payment
- $74,750
- Closing costs
- $8,970
- Reserves months
- —
- Total cash needed
- —
Loan-product check · same deal, 3 products live
Conventional
25% down · 7.5% · 30yr
- Down + closing
- —
- Monthly P&I
- —
- Monthly cashflow
- —
- DSCR
- —
- Eligible?
- —
Personal DTI + credit; lowest rate.
DSCR
20% down · 8.5% · 30yr
- Down + closing
- —
- Monthly P&I
- —
- Monthly cashflow
- —
- DSCR
- —
- Eligible?
- —
No personal income docs; deal must DSCR.
Hard money
10% down · 12.0% · 12mo
- Down + closing
- —
- Monthly P&I
- —
- Monthly cashflow
- —
- DSCR
- —
- Eligible?
- —
Short-term bridge; refi at stabilization.
Rent comps 1 comps
| Address | Beds | Baths | Sqft | Rent | $/sqft | DOM | Units | Dist |
|---|---|---|---|---|---|---|---|---|
| 224 Miller Rd Scroggins, TX | 3.0 | 2.0 | 1485 | $3,450 | $2.32 | 45d | 1 | 1.40mi |
HOA detail
- Monthly dues
- $89 · $1,068/yr
- Likely covers
- watersecurity
Listing history 29 events
-
2026-06-21days on market $299,000 Active 40 DOM
-
2026-06-19days on market $299,000 Active 38 DOM
-
2026-06-18days on market $299,000 Active 37 DOM
-
2026-06-17days on market $299,000 Active 36 DOM
-
2026-06-16days on market $299,000 Active 35 DOM
-
2026-06-15days on market $299,000 Active 34 DOM
-
2026-06-14days on market $299,000 Active 32 DOM
-
2026-06-12days on market $299,000 Active 31 DOM
-
2026-06-09days on market $299,000 Active 28 DOM
-
2026-06-08days on market $299,000 Active 27 DOM
-
2026-06-07days on market $299,000 Active 26 DOM
-
2026-06-05days on market $299,000 Active 24 DOM
-
2026-06-02days on market $299,000 Active 21 DOM
-
2026-06-01days on market $299,000 Active 20 DOM
-
2026-05-31days on market $299,000 Active 19 DOM
-
2026-05-30days on market $299,000 Active 18 DOM
-
2026-05-13$320,000 Active 1773-char remark
-
2026-04-30historical
-
2026-04-09price $320,000
-
2026-04-09price $320,000
-
2026-04-07status Active
-
2026-03-28historical
-
2026-03-17price $325,000
-
2026-03-17price $325,000
-
2026-03-10$335,000 Active
-
2025-11-19price $335,000
-
2019-12-20soldstatus
-
2019-12-19soldstatus
-
2019-11-18$135,000
ⓘ Source: listings_history table (triggers on properties + properties_extension) + one-shot
backfill from property_details.listing_events for pre-trigger history.
Tax reassessment forecast TX · Resets to sale price
- Current annual tax
- $3,512 · $293/mo
- Projected year-2 tax
- $5,472 · $456/mo
- Expected delta
- +$1,959/yr (+$163/mo · 55.8%)
ⓘ Screening estimate from a state-policy table — verify with the county assessor before closing.
Climate risk First Street
- Flood 1/10 Low 0% chance over 30 yrs
- Wildfire 3/10 Moderate
- Heat 7/10 Severe 7 d/yr ≥110°F today · 24 d/yr by 30 yrs out
- Wind 6/10 Major 27% chance of damaging wind over 30 yrs
- Air quality 2/10 Low 0 unhealthy d/yr today · 1 by 30 yrs out
Nearby sold comps map
Loading sold comps map…
Walkable amenities ~0.75 mi
Loading nearby amenities…
Taxation est. · year 1
- Rental income
- $41,400
- − Mortgage interest
- −$16,749
- − Property taxes
- −$3,512
- − Insurance
- −$1,495
- − Repairs & maintenance
- −$3,312
- − Management
- −$3,312
- − HOA
- −$1,068
- − Depreciation
- −$8,698
- Taxable income
- $3,254
- Est. tax owed @ 24.0%
- −$781
- After-tax cash flow
- $7,034/yr
For passive investors: Depreciation is non-cash, so a rental often shows a tax loss while cash-flowing — sheltering income. Rental losses are passive: they offset passive income freely, and up to $25,000/yr can offset ordinary (W-2) income if you actively participate and your MAGI is under $100k (phasing out to $0 by $150k); unused losses carry forward. On sale, claimed depreciation is recaptured at up to 25%, and gains may owe capital-gains tax (a 1031 exchange can defer both). Figures are a year-1 estimate at your 24.0% rate — not tax advice; consult a CPA.
Schools (NCES district)
- District
- Mount Vernon ISD
- NCES district ID
- 4831770
- Math proficiency
- 49% ▼ -6.00%
- Reading proficiency
- 43% ▬ 0.00%
- Median HH income
- $46,788
- Composite
- 39.19/100
- National rank
- #4021
- State rank
- #251 of 826 in TX
Livability — Mount Vernon
- Score
- 74/100
- State rank
- #190
- US rank
- #4869
Category grades
Schools grade is shown separately in the Schools card above.
Census & demographics
- Population (ZIP)
- 1,787
Population outlook (Franklin County) Hauer SSP2
- Today (2025)
- 10,621 people
- By 2030
- 10,648 · +0.3%
- By 2040
- 10,629 · +0.1%
- By 2050
- 10,486 · -1.3%
- By 2075
- 10,038 · -5.5%
- By 2100
- 8,816 · -17.0%
Race, ethnicity, and origin ACS 2023
- Neighborhood character
- Predominantly White (82%)
- Race & ethnicity
- White 82% Two or more races 16% Hispanic / Latino 14%
- Hispanic origin (detail)
- Mexican 12%
- Common ancestry
- Slovak 8% German 7% Romanian 4%
- Foreign-born
- 9% · Canada
- Languages at home
- 86% English-only · Spanish 13%
Political lean MEDSL · Franklin
- 2024 margin
- Solid R (+68.9) · D 15.3% · R 84.2%
- 2008→2024 swing
- -16.5pp toward R · 2008: -52.5pp · 2024: -68.9pp
- All cycles
- 2024: R+68.9 2020: R+67.0 2016: R+67.0 2012: R+63.4 2008: R+52.5
Not yet ingested
- Civics
- —
Market trends
- HPI YoY
- ▲ 5.13%
- Current HPI
- 234.5679
- Rent YoY
- —
- Metro
- —
- State GDP YoY
- ▲ 3.95%
- F500 in state
- 110
Industry mix (Fortune 500 HQ in TX)
| Industry | F500 HQs | Revenue |
|---|---|---|
| Energy | 16 | $1,198B |
|
||
| Technology | 5 | $198B |
|
||
| Engineering / Construction | 4 | $72B |
|
||
| Energy Services | 3 | $60B |
|
||
| Utilities | 3 | $41B |
|
||
| Healthcare | 2 | $330B |
|
||
Price history
+121.5% since first listed14 events — show timeline
- 2026-05-25 Price Changed $299,000 GTAR
- 2026-05-13 Listed $320,000 GTAR
- 2026-04-30 Listing Removed — NTREIS
- 2026-04-09 Price Changed $320,000 NTREIS
- 2026-04-09 Price Changed $320,000 GTAR
- 2026-04-07 Relisted — NTREIS
- 2026-03-28 Listing Removed — NTREIS
- 2026-03-17 Price Changed $325,000 NTREIS
- 2026-03-17 Price Changed $325,000 GTAR
- 2026-03-10 Listed $335,000 NTREIS
- 2025-11-19 Price Changed $335,000 GTAR
- 2019-12-20 Sold (Public Records) — Public Records
- 2019-12-19 Sold (MLS) — GTAR
- 2019-11-18 Listed $135,000 GTAR
Property tax history
+7.6%/yrLatest (2025): $3,512 · +18.8% YoY. Source: county tax records.
Cash-flow waterfall
monthlySold comps — $/sqft
last 12 mo · ≤1 miLoading sold comps…