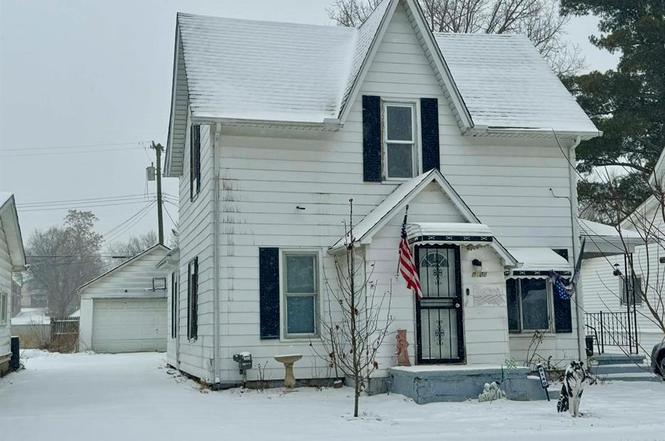
6140 1st St
Fremont, MI 48744
$76,000B+
4 bd · 2.0 ba ·
1,402 sqft ·
Built 1930
· SingleFamily
· Active
· 154 DOM
Cashflow @ list (25.0% down · 7.5%)
Estimated rent
$1,175/mo
Mortgage (P&I)
−$399
Tax + insurance
−$239
HOA
−$0
Vac / Maint / Mgmt
−$247
Net cashflow
$291/mo
Annual
$3,493/yr
Cap rate
10.89%
Cash-on-cash
16.41%
DSCR
1.73
1% rule
1.55%
Cash to close
$21,280
Investor read
- This is a 4-bed/2.0-bath single-family listed at $76k.
- At list price, monthly cash flow is $291 ($3k/yr) — positive.
- The deal already cash-flows at list — no discount required.
- Meets the 1% rule at list price ($1k rent vs $76k).
- It's been on market 154 days — a 12% lower offer ($67k) is reasonable based on typical stale-listing flexibility.
- Recommended offer: $67k (12.0% below list) — sets the bar for market timing.
- Local home prices are declining (-3.0%/yr); year-one equity from $525 of loan paydown is wiped out by about $2k of value loss. Plan a longer hold.
- Location reads 74/100 on livability (#183 in MI, #4,645 nationally) — a middle-class / working-renter tenant base. Strengths: cost of living A+, housing A+, health & safety A+; Watch: employment D, amenities F, commute F.
- Mayville Community School District (rural): math 27% / reading 33% proficiency, ranked #363 of 540 in MI (top 67%) — families likely to look elsewhere, expect single-tenant / working-renter base with shorter leases.
- Watch-outs: property tax is 3.3% of price; built in 1930 — expect roof / HVAC / electrical / plumbing capex.
- Market conditions: 32 active listings in the ZIP; 56 units permitted in Tuscola County in 2024 (0 in 5+ unit buildings).
- Tuscola County population projected at -29% by 2050 — secular population decline; favor cash flow + early exit over multi-decade hold.
- 4 sale attempts since 2y ago with the ask held roughly flat each time — persistent listings suggest the price (not the market) is what's stuck; bring a comps-based counter.
- Current owner paid $51k; 50% above their basis — modest negotiation headroom, anchor on the comps not their cost.
- At projected returns (-3.0% appreciation + 3.0% rent growth), your $21k cash investment doubles in ~8 years — after that, you're playing with house money.
- Cap rate 10.9% vs local median 2.0% in Fremont — top-decile yield for the area; either an underpriced asset or a hidden risk that comps aren't pricing in. Stress-test before assuming the spread holds.
Questions for listing agent
- It's been on market 154 days. Have you received any prior offers? Is the seller open to a 12% concession, seller financing, or rate buy-down credit?
- Built in 1930 — when were the roof, HVAC, electrical panel, plumbing, and water heater last replaced?
- Property tax is high relative to price — has the assessment been appealed recently, and will the sale trigger a re-assessment?
- Why hasn't it sold? Are there any deal-killer items the seller is aware of (foundation, flood, title, zoning, code violations)?
- Is there a deadline driving the sale (1031 exchange, divorce, estate, relocation)? That informs how much negotiation room exists.
- What's the average days-on-market for RENTAL listings here right now (not sales)? A rising rental-DOM trend means longer vacancies and softer asking-rent achievability than the comps imply.
- What's the recent tenant-quality profile in this submarket — average credit score on applications, eviction rate, late-payment / NSF rate, and stable-employment percentage? A property-management company in the area should have these aggregated.
- How much new for-sale + rental construction is in the pipeline within 1–3 miles? Heavy new supply typically softens prices + rents 12–24 months out; constrained supply supports both.
CashFlowRE · CFR-ZK0GQDCDT17JZF
· Data 6 h ago
cashflowre.app · 2026-05-29