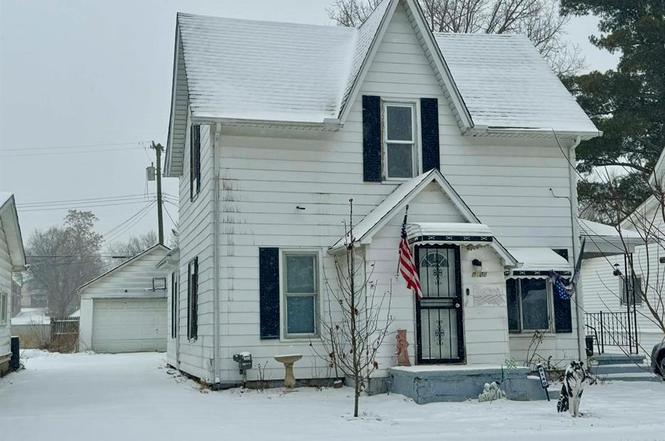
6140 1st St · Fremont, MI
Flood risk 1/10 · Minimal
- FEMA flood zone
- X (unshaded)
- Chance of flooding over 30 yrs
- 0.0%
- Est. flood insurance / yr
- $473 – $860
Fire risk 1/10 · Minimal
- Est. fire insurance / yr
- $784 – $1,456
Heat risk 2/10 · Minimal
- Hot days now (above 98°F)
- 7 days/yr
- Hot days in 30 yrs
- 14 days/yr
Wind risk 1/10 · Minimal
- Chance of severe wind over 30 yrs
- —
Air-quality risk 2/10 · Minimal
- Unhealthy air days now
- 1 days/yr
- Unhealthy air days in 30 yrs
- 3 days/yr
Risk factors via First Street. Map © Google.
Why this score? — see what drove the B+ grade
The composite is a weighted blend of 9 inputs, each scored 0–100. Each bar is that input's sub-score; the figure is the points it added to the 100-point composite (weight × sub-score).
- Cash flow +30.0/30.0
- ARV discount +15.0/15.0
- 1% rule +10.0/10.0
- DSCR +10.0/10.0
- Livability +3.7/5.0
- Schools +2.6/10.0
- Rent growth +2.5/5.0
- Condition / age +2.5/5.0
- Appreciation +0.0/10.0
$76,000
🖨 Deal sheet (PDF) 📄 Offer letter ✓ Due diligence
Listing remarks MLS
Seller is hoping a family looking for place to call HOME will show up! New flooring and fresh paint would take this to a new level. Large formal dining room in center of home. Two bdrms on main floor and more rooms upstairs. We have FIVE dogs as part of present family and we will remove them for showings. Utility room in basement. Large backyard is FENCED and an EXTRA large garage sits back behind home. Might not find a better price for a home near the town park! Pics of park attached. Local banks, shopping center and health clinics make this even better!
Key facts
- Extra large garage
- Fresh paint
- Formal dining room
Tags
Neighborhood map
What this means for you Summary
Snapshot
- This is a 4-bed/2.0-bath single-family listed at $76k.
Deal economics
- At list price, monthly cash flow is $291 ($3k/yr) — positive.
- The deal already cash-flows at list — no discount required.
- Meets the 1% rule at list price ($1k rent vs $76k).
- Recommended offer: $67k (12.0% below list) — sets the bar for market timing.
- Cap rate 10.9% vs local median 2.1% in Fremont — top-decile yield for the area; either an underpriced asset or a hidden risk that comps aren't pricing in. Stress-test before assuming the spread holds.
Location & tenants
- Location reads 74/100 on livability (#183 in MI, #4,645 nationally) — a middle-class / working-renter tenant base. Strengths: cost of living A+, housing A+, health & safety A+; Watch: employment D, amenities F, commute F.
- Mayville Community School District (rural): math 27% / reading 33% proficiency, ranked #363 of 540 in MI (top 67%) — families likely to look elsewhere, expect single-tenant / working-renter base with shorter leases.
- Market conditions: 32 active listings in the ZIP; 56 units permitted in Tuscola County in 2024 (0 in 5+ unit buildings).
Forward outlook
- Local home prices are declining (-3.0%/yr); year-one equity from $525 of loan paydown is wiped out by about $2k of value loss. Plan a longer hold.
- Tuscola County population projected at -29% by 2050 — secular population decline; favor cash flow + early exit over multi-decade hold.
- At projected returns (-3.0% appreciation + 3.0% rent growth), your $21k cash investment doubles in ~8 years — after that, you're playing with house money.
Negotiation context
- It's been on market 152 days — a 12% lower offer ($67k) is reasonable based on typical stale-listing flexibility.
- 4 sale attempts since 2y ago with the ask held roughly flat each time — persistent listings suggest the price (not the market) is what's stuck; bring a comps-based counter.
- Current owner paid $51k; 50% above their basis — modest negotiation headroom, anchor on the comps not their cost.
Risks & watch-outs
- Watch-outs: property tax is 3.3% of price; built in 1930 — expect roof / HVAC / electrical / plumbing capex.
Questions for the listing agent
- It's been on market 152 days. Have you received any prior offers? Is the seller open to a 12% concession, seller financing, or rate buy-down credit?
- Built in 1930 — when were the roof, HVAC, electrical panel, plumbing, and water heater last replaced?
- Property tax is high relative to price — has the assessment been appealed recently, and will the sale trigger a re-assessment?
- Why hasn't it sold? Are there any deal-killer items the seller is aware of (foundation, flood, title, zoning, code violations)?
- Is there a deadline driving the sale (1031 exchange, divorce, estate, relocation)? That informs how much negotiation room exists.
- What's the average days-on-market for RENTAL listings here right now (not sales)? A rising rental-DOM trend means longer vacancies and softer asking-rent achievability than the comps imply.
- What's the recent tenant-quality profile in this submarket — average credit score on applications, eviction rate, late-payment / NSF rate, and stable-employment percentage? A property-management company in the area should have these aggregated.
- How much new for-sale + rental construction is in the pipeline within 1–3 miles? Heavy new supply typically softens prices + rents 12–24 months out; constrained supply supports both.
Investment metrics
- 1% rule
- 1.55% ✓
- Cap rate
- 10.89%
- Cash-on-cash
- 16.41%
- DSCR
- 1.73
- GRM
- 5.4
CMA / ARV
- ARV (median comp)
- $139,385
- List price
- $76,000
- Delta
- -45.47%
- Verdict
- UNDERPRICED
- Comps
- 20 within 1.0 mi
Show comp detail 8 sales within ~0.75 mi
| Address | Dist | Beds/Ba | Sqft | Sold | Price | $/sf | Match |
|---|---|---|---|---|---|---|---|
| 6317 2nd St | 0.19mi | 3/1.5 (-1) | 1,268 (-10%) | 7mo | $165,000 | $130 | 62 |
| 5963 Fox St | 0.34mi | 4/1.5 | 1,324 (-6%) | 17mo | $149,000 | $113 | 59 |
| 5985 Fox St | 0.31mi | 4/1.0 | 1,542 (+10%) | 11mo | $47,000 | $30 | 56 |
| 729 E Turner St | 0.33mi | 3/2.0 (-1) | 1,350 (-4%) | 21mo | $129,900 | $96 | 56 |
| 5888 Fulton St | 0.43mi | 3/1.0 (-1) | 1,500 (+7%) | 5mo | $90,000 | $60 | 55 |
| 6109 4th St | 0.24mi | 3/2.0 (-1) | 1,200 (-14%) | 14mo | $158,000 | $132 | 49 |
| 5960 Trend St | 0.30mi | 3/1.0 (-1) | 1,586 (+13%) | 15mo | $135,000 | $85 | 43 |
| 6104 Blackmore St | 0.38mi | 3/2.0 (-1) | 1,200 (-14%) | 12mo | $165,000 | $138 | 43 |
Match score weights: distance 35% · size 25% · config 20% · recency 20%. Top-matched comps best support the ARV.
Projected returns pro-forma
-3.0% appreciation · 3.0% rent growth · sell at horizon
- IRR
- 7.6%
- Equity multiple
- 1.30×
- Total profit
- $6,308
- Equity at exit
- $11,332
- IRR
- 16.9%
- Equity multiple
- 2.40×
- Total profit
- $29,715
- Equity at exit
- $6,571
Cash invested: $21,280 (down + closing). Projections, not guarantees.
Landlord ↔ Tenant lean methodology
- Overall (STATE)
- 62 Landlord-Friendly
- State Michigan
- 62 Landlord-Friendly · EVEN
- County
- — inherits STATE
- City
- — inherits STATE
ZIP-level market 48744
- Home prices YoY
- -11.9%
- Active inventory
- 32
- Price-to-rent
- 5.4×
Monthly cashflow live
- Estimated rent
- $1,175 medium interval (Pro) →
- Mortgage (P&I)
- −$399
- Tax from tax record
- −$207 /mo · $2,488/yr
- Insurance
- −$32
- HOA
- −$0
- Vacancy / Maint / Mgmt
- −$247
- Net cashflow
- $291
Break-even live
Sensitivity live
| Price | -10% $334 | -5% $313 | +0% $291 | +5% $270 | +10% $248 |
|---|---|---|---|---|---|
| Rent | -10% $198 | -5% $245 | +0% $291 | +5% $337 | +10% $384 |
| Rate | -1.0pp $329 | -0.5pp $310 | base $291 | +0.5pp $271 | +1.0pp $251 |
UW: 25.0% down · 7.5% · 30yr · 1.5% tax · 5.0% vac · 8.0% maint · 8.0% mgmt
Financing live
Cash to close
- Down payment
- $19,000
- Closing costs
- $2,280
- Reserves months
- —
- Total cash needed
- —
Loan-product check · same deal, 3 products live
Conventional
25% down · 7.5% · 30yr
- Down + closing
- —
- Monthly P&I
- —
- Monthly cashflow
- —
- DSCR
- —
- Eligible?
- —
Personal DTI + credit; lowest rate.
DSCR
20% down · 8.5% · 30yr
- Down + closing
- —
- Monthly P&I
- —
- Monthly cashflow
- —
- DSCR
- —
- Eligible?
- —
No personal income docs; deal must DSCR.
Hard money
10% down · 12.0% · 12mo
- Down + closing
- —
- Monthly P&I
- —
- Monthly cashflow
- —
- DSCR
- —
- Eligible?
- —
Short-term bridge; refi at stabilization.
Listing history 30 events
-
2026-06-18days on market $76,000 Active 152 DOM
-
2026-06-17days on market $76,000 Active 151 DOM
-
2026-06-16days on market $76,000 Active 150 DOM
-
2026-06-15days on market $76,000 Active 149 DOM
-
2026-06-13days on market $76,000 Active 147 DOM
-
2026-06-12days on market $76,000 Active 146 DOM
-
2026-06-09days on market $76,000 Active 143 DOM
-
2026-06-08days on market $76,000 Active 142 DOM
-
2026-06-07days on market $76,000 Active 141 DOM
-
2026-06-05days on market $76,000 Active 139 DOM
-
2026-06-04days on market $76,000 Active 137 DOM
-
2026-06-02days on market $76,000 Active 136 DOM
-
2026-06-01days on market $76,000 Active 135 DOM
-
2026-05-31days on market $76,000 Active 134 DOM
-
2026-05-31days on market $76,000 Active 133 DOM
-
2026-01-14$76,000 Active 561-char remark
Show marketing remark (563 chars)
Seller is hoping a family looking for place to call HOME will show up! New flooring and fresh paint would take this to a new level. Large formal dining room in center of home. Two bdrms on main floor and more rooms upstairs. We have FIVE dogs as part of present family and we will remove them for showings. Utility room in basement. Large backyard is FENCED and an EXTRA large garage sits back behind home. Might not find a better price for a home near the town park! Pics of park attached. Local banks, shopping center and health clinics make this even better!
-
2026-01-14$76,000 Active 563-char remark
Show marketing remark (563 chars)
Seller is hoping a family looking for place to call HOME will show up! New flooring and fresh paint would take this to a new level. Large formal dining room in center of home. Two bdrms on main floor and more rooms upstairs. We have FIVE dogs as part of present family and we will remove them for showings. Utility room in basement. Large backyard is FENCED and an EXTRA large garage sits back behind home. Might not find a better price for a home near the town park! Pics of park attached. Local banks, shopping center and health clinics make this even better!
-
2025-04-24historical
-
2025-04-24historical
-
2025-03-21price $89,900
-
2025-03-21price $89,900
-
2024-10-09price $94,900
-
2024-10-09price $94,900
-
2024-08-19price $86,900
-
2024-08-19price $86,900
-
2024-07-18$90,000 Active
-
2024-07-18$90,000 Active
-
2024-07-18historical
-
2024-07-18historical
-
1992-04-23soldstatus $50,800
ⓘ Source: listings_history table (triggers on properties + properties_extension) + one-shot
backfill from property_details.listing_events for pre-trigger history.
Tax reassessment forecast MI · Partial reset (capped growth)
- Current annual tax
- $2,488 · $207/mo
- Projected year-2 tax
- $2,488 · $207/mo
- Expected delta
- $0/yr ($0/mo · 0.0%)
ⓘ Screening estimate from a state-policy table — verify with the county assessor before closing.
Climate risk First Street
- Flood 1/10 Low FEMA zone X (unshaded) · 0% chance over 30 yrs
- Wildfire 1/10 Low
- Heat 2/10 Low 7 d/yr ≥98°F today · 14 d/yr by 30 yrs out
- Wind 1/10 Low
- Air quality 2/10 Low 1 unhealthy d/yr today · 3 by 30 yrs out
Nearby sold comps map
Loading sold comps map…
Walkable amenities ~0.75 mi
Loading nearby amenities…
Taxation est. · year 1
- Rental income
- $14,105
- − Mortgage interest
- −$4,257
- − Property taxes
- −$2,488
- − Insurance
- −$380
- − Repairs & maintenance
- −$1,128
- − Management
- −$1,128
- − Depreciation
- −$2,211
- Taxable income
- $2,512
- Est. tax owed @ 24.0%
- −$603
- After-tax cash flow
- $2,890/yr
For passive investors: Depreciation is non-cash, so a rental often shows a tax loss while cash-flowing — sheltering income. Rental losses are passive: they offset passive income freely, and up to $25,000/yr can offset ordinary (W-2) income if you actively participate and your MAGI is under $100k (phasing out to $0 by $150k); unused losses carry forward. On sale, claimed depreciation is recaptured at up to 25%, and gains may owe capital-gains tax (a 1031 exchange can defer both). Figures are a year-1 estimate at your 24.0% rate — not tax advice; consult a CPA.
Schools (NCES district)
- District
- Mayville Community School District
- NCES district ID
- 2623280
- Math proficiency
- 27% ▲ 1.00%
- Reading proficiency
- 33% ▼ -3.00%
- Median HH income
- $45,303
- Composite
- 25.73/100
- National rank
- #7379
- State rank
- #363 of 540 in MI
Livability — Fremont
- Score
- 74/100
- State rank
- #183
- US rank
- #4645
Category grades
Schools grade is shown separately in the Schools card above.
Census & demographics
- Census place
- Mayville, MI
- City population
- 12,079
- Population (ZIP)
- 4,387
Population outlook (Tuscola County) Hauer SSP2
- Today (2025)
- 49,930 people
- By 2030
- 47,294 · -5.3%
- By 2040
- 41,504 · -16.9%
- By 2050
- 35,560 · -28.8%
- By 2075
- 24,455 · -51.0%
- By 2100
- 16,507 · -66.9%
Race, ethnicity, and origin ACS 2023
- Neighborhood character
- Predominantly White (95%)
- Race & ethnicity
- White 95% Two or more races 2% Hispanic / Latino 2%
- Common ancestry
- Romanian 5% Slovak 3% Lithuanian 3%
- Foreign-born
- 1%
- Languages at home
- 97% English-only · Spanish 2% Tagalog/Filipino 1%
Political lean MEDSL · Tuscola
- 2024 margin
- Solid R (+43.0) · D 27.9% · R 70.9% · Other 1.3%
- 2008→2024 swing
- -42.1pp toward R · 2008: -0.8pp · 2024: -43.0pp
- All cycles
- 2024: R+43.0 2020: R+39.3 2016: R+38.0 2012: R+10.8 2008: R+0.8
Not yet ingested
- Civics
- —
Market trends
- HPI YoY
- ▼ -37.01%
- Current HPI
- 274.1836
- Rent YoY
- —
- Metro
- —
- State GDP YoY
- ▲ 1.37%
- F500 in state
- 28
Industry mix (Fortune 500 HQ in MI)
| Industry | F500 HQs | Revenue |
|---|---|---|
| Automotive Parts | 3 | $48B |
|
||
| Automotive | 2 | $372B |
|
||
| Chemicals | 1 | $45B |
|
||
| Automotive Retail | 1 | $29B |
|
||
| Healthcare / Medical Devices | 1 | $23B |
|
||
| Automotive Technology | 1 | $20B |
|
||
Price history
+49.6% since first listed15 events — show timeline
- 2026-01-14 Listed $76,000 REALCOMP
- 2026-01-14 Listed $76,000 MiRealSource-MiMLS
- 2025-04-24 Listing Removed — MiRealSource-MiMLS
- 2025-04-24 Listing Removed — REALCOMP
- 2025-03-21 Price Changed $89,900 MiRealSource-MiMLS
- 2025-03-21 Price Changed $89,900 REALCOMP
- 2024-10-09 Price Changed $94,900 MiRealSource-MiMLS
- 2024-10-09 Price Changed $94,900 REALCOMP
- 2024-08-19 Price Changed $86,900 MiRealSource-MiMLS
- 2024-08-19 Price Changed $86,900 REALCOMP
- 2024-07-18 Listed $90,000 MiRealSource-MiMLS
- 2024-07-18 Listed $90,000 REALCOMP
- 2024-07-18 Coming Soon — REALCOMP
- 2024-07-18 Coming Soon — MiRealSource-MiMLS
- 1992-04-23 Sold (Public Records) $50,800 Public Records
Property tax history
+5.0%/yrLatest (2025): $2,488 · -17.6% YoY. Source: county tax records.
Cash-flow waterfall
monthlySold comps — $/sqft
last 12 mo · ≤1 miLoading sold comps…