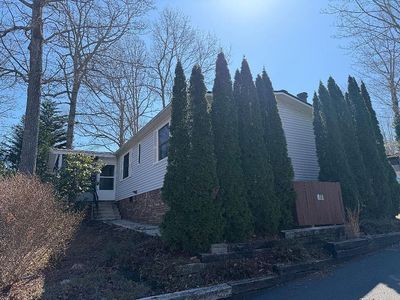
506 Morning Spring Dr
East Flat Rock, NC 28731
$129,000B-
3 bd · 2.0 ba ·
1,240 sqft ·
Built 1987
· Manufactured
· Active
· 1 DOM
Cashflow @ list (25.0% down · 7.5%)
Estimated rent
$1,506/mo
Mortgage (P&I)
−$676
Tax + insurance
−$79
HOA
−$0
Vac / Maint / Mgmt
−$316
Net cashflow
$434/mo
Annual
$5,208/yr
Cap rate
10.33%
Cash-on-cash
14.42%
DSCR
1.64
1% rule
1.17%
Cash to close
$36,120
Investor read
- This is a 3-bed/2.0-bath manufactured listed at $129k.
- At list price, monthly cash flow is $434 ($5k/yr) — positive.
- The deal already cash-flows at list — no discount required.
- Meets the 1% rule at list price ($2k rent vs $129k).
- Only 1 days on market — expect competitive offers; lowballing is unlikely to land.
- Local home prices are declining (-3.0%/yr); year-one equity from $892 of loan paydown is wiped out by about $4k of value loss. Plan a longer hold.
- Location reads 59/100 on livability (#536 in NC) — a working-class tenant base; expect higher turnover. Strengths: cost of living A+, housing A+; Watch: employment C-, amenities F, commute F.
- Henderson County Schools (suburban): math 48% / reading 52% proficiency, ranked #64 of 178 in NC (top 36%) — acceptable for families but not a draw, mixed tenant base, ~2y average lease.
- Zoned schools: Hillandale Elementary (math 35% / reading 41%, grade F, #759 of 1,410 statewide, top 54%, 490 students, 68% FRL); Flat Rock Middle (math 36% / reading 44%, grade F, #222 of 475 statewide, top 49%, 706 students, 70% FRL); East Henderson High (math 62% / reading 63%, grade B-, #179 of 535 statewide, top 34%, 965 students, 61% FRL) — zoned schools average 66% FRL vs 46% district-wide (20 pts higher); higher-poverty schools than district average — tighter screening recommended.
- Market conditions: 175 active listings in the ZIP; 2 comparable units currently listed for rent nearby; 1,534 units permitted in Henderson County in 2024 (558 in 5+ unit buildings).
- Henderson County population projected at +20% by 2050 — long-run rental-demand tailwind backs the buy-and-hold thesis.
- At projected returns (-3.0% appreciation + 3.0% rent growth), your $36k cash investment doubles in ~9 years — after that, you're playing with house money.
- Cap rate 10.3% vs local median 3.5% in East Flat Rock — top-decile yield for the area; either an underpriced asset or a hidden risk that comps aren't pricing in. Stress-test before assuming the spread holds.
Questions for listing agent
- Is there a deadline driving the sale (1031 exchange, divorce, estate, relocation)? That informs how much negotiation room exists.
- Schools are D-rated, which usually means shorter tenancies and higher turnover. Who's the typical renter profile here, and what's been the actual vacancy rate?
- What's the average days-on-market for RENTAL listings here right now (not sales)? A rising rental-DOM trend means longer vacancies and softer asking-rent achievability than the comps imply.
- What's the recent tenant-quality profile in this submarket — average credit score on applications, eviction rate, late-payment / NSF rate, and stable-employment percentage? A property-management company in the area should have these aggregated.
- How much new for-sale + rental construction is in the pipeline within 1–3 miles? Heavy new supply typically softens prices + rents 12–24 months out; constrained supply supports both.
CashFlowRE · CFR-ZKCGN5A261T9CY
· Data 3 weeks ago
cashflowre.app · 2026-05-29