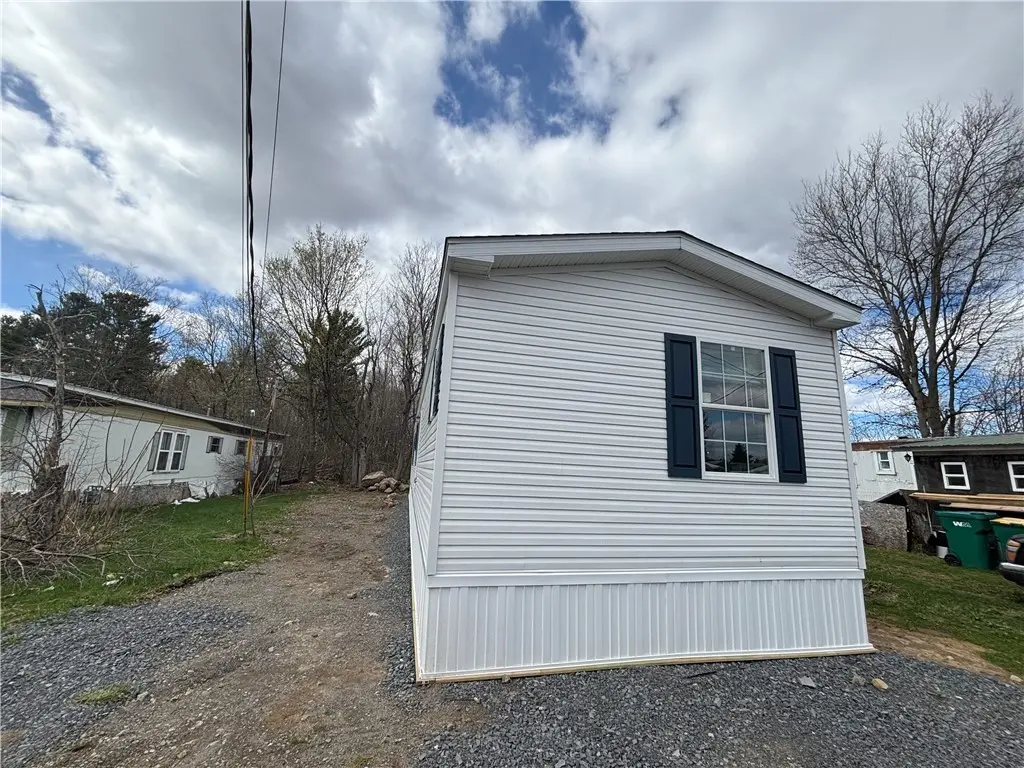
27634 County Route 342, Lot 215
Fort Drum, NY 13612
$76,500B+
3 bd · 2.0 ba ·
900 sqft ·
Built 2026
· Manufactured
· Active
· 56 DOM
Cashflow @ list (25.0% down · 7.5%)
Estimated rent
$1,336/mo
Mortgage (P&I)
−$401
Tax + insurance
−$128
HOA
−$0
Vac / Maint / Mgmt
−$280
Net cashflow
$526/mo
Annual
$6,317/yr
Cap rate
14.55%
Cash-on-cash
29.49%
DSCR
2.31
1% rule
1.75%
Cash to close
$21,420
Investor read
- This is a 3-bed/2.0-bath manufactured listed at $76k. Condition is rated good.
- At list price, monthly cash flow is $526 ($6k/yr) — positive.
- The deal already cash-flows at list — no discount required.
- Meets the 1% rule at list price ($1k rent vs $76k).
- It's been on market 56 days — a 3% lower offer ($74k) is reasonable based on typical stale-listing flexibility.
- Recommended offer: $74k (3.0% below list) — sets the bar for market timing.
- In year one you build about $3k of equity ($529 loan paydown + $2k appreciation (2.8% local appreciation)).
- Location reads 60/100 on livability (#996 in NY) — a middle-class / working-renter tenant base. Strengths: crime A, housing B; Watch: employment C-, health & safety D, amenities F.
- Indian River Central School District (rural): math 33% / reading 50% proficiency, ranked #502 of 590 in NY (top 85%) — families likely to look elsewhere, expect single-tenant / working-renter base with shorter leases.
- Zoned schools: Calcium Primary School (math 22% / reading 52%, grade F, #1,519 of 2,108 statewide, top 74%, 545 students, 52% FRL); Indian River Middle School (math 26% / reading 50%, grade F, #442 of 729 statewide, top 61%, 672 students, 60% FRL); Indian River High School (math 98% / reading 90%, grade A+, #124 of 1,100 statewide, top 12%, 781 students, 49% FRL) — zoned schools average 54% FRL vs 28% district-wide (26 pts higher); higher-poverty schools than district average — tighter screening recommended.
- Zoned-school proficiency averages 56% at this address vs 42% district-wide (+15 pts) — the actual schools serving this property are materially stronger than the Indian River Central School District average implies; a family-tenant draw the district grade alone would hide.
- Market conditions: 21 active listings in the ZIP; 196 units permitted in Jefferson County in 2024 (0 in 5+ unit buildings).
- Jefferson County population projected at -12% by 2050 — secular population decline; favor cash flow + early exit over multi-decade hold.
- At projected returns (2.8% appreciation + 3.0% rent growth), your $21k cash investment doubles in ~3 years — after that, you're playing with house money.
Questions for listing agent
- It's been on market 56 days. Have you received any prior offers? Is the seller open to a 3% concession, seller financing, or rate buy-down credit?
- Is there a deadline driving the sale (1031 exchange, divorce, estate, relocation)? That informs how much negotiation room exists.
- Schools are D-rated, which usually means shorter tenancies and higher turnover. Who's the typical renter profile here, and what's been the actual vacancy rate?
- What's the average days-on-market for RENTAL listings here right now (not sales)? A rising rental-DOM trend means longer vacancies and softer asking-rent achievability than the comps imply.
- What's the recent tenant-quality profile in this submarket — average credit score on applications, eviction rate, late-payment / NSF rate, and stable-employment percentage? A property-management company in the area should have these aggregated.
- How much new for-sale + rental construction is in the pipeline within 1–3 miles? Heavy new supply typically softens prices + rents 12–24 months out; constrained supply supports both.
CashFlowRE · CFR-ZKW3J78CNQZ38E
· Data 12 h ago
cashflowre.app · 2026-05-29