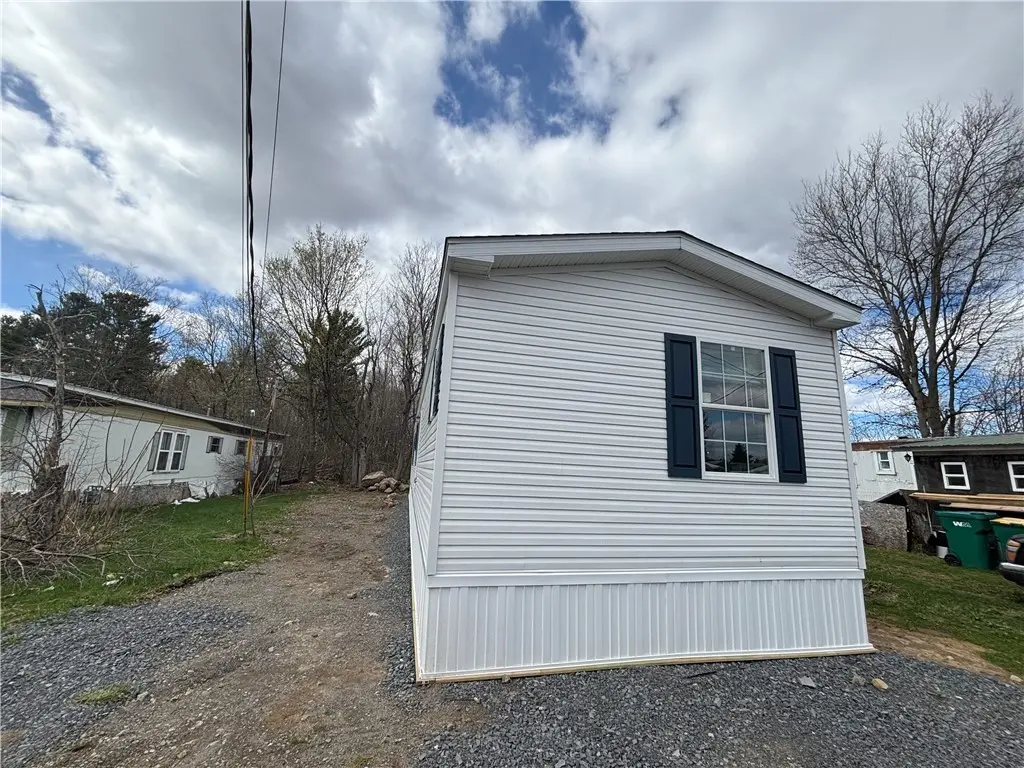
27634 County Route 342, Lot 215 · Fort Drum, NY
Flood risk 1/10 · Minimal
- FEMA flood zone
- X (unshaded)
- Chance of flooding over 30 yrs
- 0.0%
- Est. flood insurance / yr
- $507 – $1,088
Fire risk 2/10 · Minimal
- Est. fire insurance / yr
- $691 – $1,283
Heat risk 1/10 · Minimal
- Hot days now (above 91°F)
- 7 days/yr
- Hot days in 30 yrs
- 15 days/yr
Wind risk 1/10 · Minimal
- Chance of severe wind over 30 yrs
- —
Air-quality risk 2/10 · Minimal
- Unhealthy air days now
- 1 days/yr
- Unhealthy air days in 30 yrs
- 1 days/yr
Risk factors via First Street. Map © Google.
Why this score? — see what drove the B+ grade
The composite is a weighted blend of 9 inputs, each scored 0–100. Each bar is that input's sub-score; the figure is the points it added to the 100-point composite (weight × sub-score).
- Cash flow +30.0/30.0
- 1% rule +10.0/10.0
- DSCR +10.0/10.0
- ARV discount +7.5/15.0
- Appreciation +6.4/10.0
- Condition / age +4.0/5.0
- Schools +3.5/10.0
- Livability +3.0/5.0
- Rent growth +2.5/5.0
$76,500
🖨 Deal sheet (PDF) 📄 Offer letter ✓ Due diligence
Listing remarks
Brand new mobile home in a well maintained park! Located between Watertown and Fort Drum, this move-in ready home offers the perfect balance of comfort, convenience, and affordability. Enjoy being just a short drive from numerous state parks, outdoor recreation areas, shopping, and dining. Step inside to find a bright, modern interior featuring an open-concept layout, new appliances, and stylish finishes throughout. The thoughtfully designed floor plan provides comfortable living space, ample storage, and low-maintenance living. Enjoy homeownership without the high costs of traditional housing—ideal for those seeking simplicity, convenience, and value. Whether you're downsizing, purch
Key facts
- Well maintained park
- New appliances
- Open-concept layout
Tags
Property features AI
Finance
- Financial info: Land lease of $515
Exterior
- Parking: No garage
- Utilities: Public water connected; Sewer connected
- Home design: Single-wide mobile home; One story; Resale property
- Construction: Aluminum siding; Crawl space foundation; Existing (previously built)
- Exterior features: Covered porch; Gravel driveway; Irregular lot
Interior
- Kitchen: Free-standing range; Gas oven; Gas range; Oven; Refrigerator
- Bedrooms: 3 main-level bedrooms
- Flooring: Vinyl; Varies
- Bathrooms: 2 full bathrooms (both on main level)
- Heating & cooling: Propane forced-air heating; Has heating
- Interior features: Ceiling fan(s); Eat-in kitchen; Separate/formal living room; Main-level primary bedroom; Bedroom on main level
- Laundry & utility: Laundry on main level; Propane water heater
Neighborhood map
What this means for you Summary
Snapshot
- This is a 3-bed/2.0-bath manufactured listed at $76k. Condition is rated good.
Deal economics
- At list price, monthly cash flow is $526 ($6k/yr) — positive.
- The deal already cash-flows at list — no discount required.
- Meets the 1% rule at list price ($1k rent vs $76k).
- Recommended offer: $74k (3.0% below list) — sets the bar for market timing.
Location & tenants
- Location reads 60/100 on livability (#996 in NY) — a middle-class / working-renter tenant base. Strengths: crime A, housing B; Watch: employment C-, health & safety D, amenities F.
- Indian River Central School District (rural): math 33% / reading 50% proficiency, ranked #502 of 590 in NY (top 85%) — families likely to look elsewhere, expect single-tenant / working-renter base with shorter leases.
- Zoned schools: Calcium Primary School (math 22% / reading 52%, grade F, #1,519 of 2,108 statewide, top 74%, 545 students, 52% FRL); Indian River Middle School (math 26% / reading 50%, grade F, #442 of 729 statewide, top 61%, 672 students, 60% FRL); Indian River High School (math 98% / reading 90%, grade A+, #124 of 1,100 statewide, top 12%, 781 students, 49% FRL) — zoned schools average 54% FRL vs 28% district-wide (26 pts higher); higher-poverty schools than district average — tighter screening recommended.
- Zoned-school proficiency averages 56% at this address vs 42% district-wide (+15 pts) — the actual schools serving this property are materially stronger than the Indian River Central School District average implies; a family-tenant draw the district grade alone would hide.
- Market conditions: 21 active listings in the ZIP; 196 units permitted in Jefferson County in 2024 (0 in 5+ unit buildings).
Forward outlook
- In year one you build about $3k of equity ($529 loan paydown + $2k appreciation (2.8% local appreciation)).
- Jefferson County population projected at -12% by 2050 — secular population decline; favor cash flow + early exit over multi-decade hold.
- At projected returns (2.8% appreciation + 3.0% rent growth), your $21k cash investment doubles in ~3 years — after that, you're playing with house money.
Negotiation context
- It's been on market 56 days — a 3% lower offer ($74k) is reasonable based on typical stale-listing flexibility.
Questions for the listing agent
- It's been on market 56 days. Have you received any prior offers? Is the seller open to a 3% concession, seller financing, or rate buy-down credit?
- Is there a deadline driving the sale (1031 exchange, divorce, estate, relocation)? That informs how much negotiation room exists.
- Schools are D-rated, which usually means shorter tenancies and higher turnover. Who's the typical renter profile here, and what's been the actual vacancy rate?
- What's the average days-on-market for RENTAL listings here right now (not sales)? A rising rental-DOM trend means longer vacancies and softer asking-rent achievability than the comps imply.
- What's the recent tenant-quality profile in this submarket — average credit score on applications, eviction rate, late-payment / NSF rate, and stable-employment percentage? A property-management company in the area should have these aggregated.
- How much new for-sale + rental construction is in the pipeline within 1–3 miles? Heavy new supply typically softens prices + rents 12–24 months out; constrained supply supports both.
Investment metrics
- 1% rule
- 1.75% ✓
- Cap rate
- 14.55%
- Cash-on-cash
- 29.49%
- DSCR
- 2.31
- GRM
- 4.8
CMA / ARV
No comps found within radius.
Projected returns pro-forma
2.77% appreciation · 3.0% rent growth · sell at horizon
- IRR
- 35.0%
- Equity multiple
- 2.95×
- Total profit
- $41,849
- Equity at exit
- $33,423
- IRR
- 35.4%
- Equity multiple
- 5.82×
- Total profit
- $103,178
- Equity at exit
- $50,763
Cash invested: $21,420 (down + closing). Projections, not guarantees.
Landlord ↔ Tenant lean methodology
- Overall (STATE)
- 15 Strongly Tenant-Friendly
- State New York
- 15 Strongly Tenant-Friendly · D+10
- County
- — inherits STATE
- City
- — inherits STATE
ZIP-level market 13612
- Home prices YoY
- 0.7%
- Active inventory
- 21
- Price-to-rent
- 4.8×
Monthly cashflow live
- Estimated rent
- $1,336 medium interval (Pro) →
- Mortgage (P&I)
- −$401
- Tax est. 1.5%
- −$96 /mo · $1,148/yr
- Insurance
- −$32
- HOA
- −$0
- Lot rent leased land?
- −$0
- Vacancy / Maint / Mgmt
- −$280
- Net cashflow
- $526
Break-even live
Sensitivity live
| Price | -10% $579 | -5% $553 | +0% $526 | +5% $500 | +10% $474 |
|---|---|---|---|---|---|
| Rent | -10% $421 | -5% $474 | +0% $526 | +5% $579 | +10% $632 |
| Rate | -1.0pp $565 | -0.5pp $546 | base $526 | +0.5pp $507 | +1.0pp $486 |
UW: 25.0% down · 7.5% · 30yr · 1.5% tax · 5.0% vac · 8.0% maint · 8.0% mgmt
Financing live
Cash to close
- Down payment
- $19,125
- Closing costs
- $2,295
- Reserves months
- —
- Total cash needed
- —
Loan-product check · same deal, 3 products live
Conventional
25% down · 7.5% · 30yr
- Down + closing
- —
- Monthly P&I
- —
- Monthly cashflow
- —
- DSCR
- —
- Eligible?
- —
Personal DTI + credit; lowest rate.
DSCR
20% down · 8.5% · 30yr
- Down + closing
- —
- Monthly P&I
- —
- Monthly cashflow
- —
- DSCR
- —
- Eligible?
- —
No personal income docs; deal must DSCR.
Hard money
10% down · 12.0% · 12mo
- Down + closing
- —
- Monthly P&I
- —
- Monthly cashflow
- —
- DSCR
- —
- Eligible?
- —
Short-term bridge; refi at stabilization.
Listing history 19 events
-
2026-06-22days on market $76,500 Active 56 DOM
-
2026-06-19days on market $76,500 Active 53 DOM
-
2026-06-18days on market $76,500 Active 52 DOM
-
2026-06-17days on market $76,500 Active 51 DOM
-
2026-06-16days on market $76,500 Active 50 DOM
-
2026-06-15days on market $76,500 Active 49 DOM
-
2026-06-14days on market $76,500 Active 47 DOM
-
2026-06-12days on market $76,500 Active 46 DOM
-
2026-06-09days on market $76,500 Active 43 DOM
-
2026-06-08days on market $76,500 Active 42 DOM
-
2026-06-07days on market $76,500 Active 41 DOM
-
2026-06-05days on market $76,500 Active 38 DOM
-
2026-06-03days on market $76,500 Active 37 DOM
-
2026-06-02days on market $76,500 Active 36 DOM
-
2026-06-01days on market $76,500 Active 35 DOM
-
2026-05-31days on market $76,500 Active 34 DOM
-
2026-05-30days on market $76,500 Active 33 DOM
-
2026-04-27price $76,500
-
2026-04-27$71,900 Active
ⓘ Source: listings_history table (triggers on properties + properties_extension) + one-shot
backfill from property_details.listing_events for pre-trigger history.
Climate risk First Street
- Flood 1/10 Low FEMA zone X (unshaded) · 0% chance over 30 yrs
- Wildfire 2/10 Low
- Heat 1/10 Low 7 d/yr ≥91°F today · 15 d/yr by 30 yrs out
- Wind 1/10 Low
- Air quality 2/10 Low 1 unhealthy d/yr today · 1 by 30 yrs out
Nearby sold comps map
Loading sold comps map…
Walkable amenities ~0.75 mi
Loading nearby amenities…
Taxation est. · year 1
- Rental income
- $16,027
- − Mortgage interest
- −$4,285
- − Property taxes
- −$1,148
- − Insurance
- −$382
- − Repairs & maintenance
- −$1,282
- − Management
- −$1,282
- − Depreciation
- −$2,225
- Taxable income
- $5,422
- Est. tax owed @ 24.0%
- −$1,301
- After-tax cash flow
- $5,016/yr
For passive investors: Depreciation is non-cash, so a rental often shows a tax loss while cash-flowing — sheltering income. Rental losses are passive: they offset passive income freely, and up to $25,000/yr can offset ordinary (W-2) income if you actively participate and your MAGI is under $100k (phasing out to $0 by $150k); unused losses carry forward. On sale, claimed depreciation is recaptured at up to 25%, and gains may owe capital-gains tax (a 1031 exchange can defer both). Figures are a year-1 estimate at your 24.0% rate — not tax advice; consult a CPA.
Condition & rehab AI · 2 photos
This move-in ready mobile home in a well-maintained park offers a good condition with minimal repairs needed. Enhancements to the exterior and interior can significantly boost its resale and rental value.
Value-add opportunities
- Both Painting the exterior siding — Enhances curb appeal and value
- Both Landscaping improvements — Enhances curb appeal and value
- Both Interior touch-ups — Enhances interior appearance and value
Renovation cost estimate screening
Value-add ROI direction
- Both Painting the exterior siding — Enhances curb appeal and value ↑
- Both Landscaping improvements — Enhances curb appeal and value ↑
- Both Interior touch-ups — Enhances interior appearance and value ↑
ⓘ Cost ranges are severity-bucket heuristics (US national rule-of-thumb). Get contractor quotes + a written scope before underwriting a rehab budget.
Schools (NCES district)
- District
- Indian River Central School District
- NCES district ID
- 3615300
- Math proficiency
- 33% ▼ -21.00%
- Reading proficiency
- 50% ▲ 1.00%
- Median HH income
- $45,599
- Composite
- 35.25/100
- National rank
- #4977
- State rank
- #502 of 590 in NY
Livability — Fort Drum
- Score
- 60/100
- State rank
- #996
- US rank
- #19459
Category grades
Schools grade is shown separately in the Schools card above.
Census & demographics
- City population
- 16,673
- Population (ZIP)
- 2,940
Population outlook (Jefferson County) Hauer SSP2
- Today (2025)
- 111,748 people
- By 2030
- 109,370 · -2.1%
- By 2040
- 103,828 · -7.1%
- By 2050
- 98,523 · -11.8%
- By 2075
- 91,422 · -18.2%
- By 2100
- 78,214 · -30.0%
Race, ethnicity, and origin ACS 2023
- Neighborhood character
- Predominantly White (91%)
- Race & ethnicity
- White 91% Two or more races 4% Asian 3% Hispanic / Latino 3%
- Common ancestry
- Lithuanian 4% Romanian 3% Italian 2%
- Foreign-born
- 6% · South Korea, Canada
- Languages at home
- 94% English-only · Korean 3% Spanish 2% Tagalog/Filipino 1%
Political lean MEDSL · Jefferson
- 2024 margin
- Strong R (+23.6) · D 38.2% · R 61.8%
- 2008→2024 swing
- -18.3pp toward R · 2008: -5.3pp · 2024: -23.6pp
- All cycles
- 2024: R+23.6 2020: R+19.0 2016: R+22.4 2012: R+2.9 2008: R+5.3
Not yet ingested
- Civics
- —
Market trends
- HPI YoY
- ▲ 2.77%
- Current HPI
- 415.9603
- Rent YoY
- —
- Metro
- —
- State GDP YoY
- ▲ 2.60%
- F500 in state
- 92
Industry mix (Fortune 500 HQ in NY)
| Industry | F500 HQs | Revenue |
|---|---|---|
| Financial Services | 10 | $950B |
|
||
| Consumer Goods | 9 | $162B |
|
||
| Insurance | 4 | $225B |
|
||
| Telecommunications | 2 | $144B |
|
||
| Pharmaceuticals | 2 | $112B |
|
||
| Media / Entertainment | 2 | $69B |
|
||
Price history
+6.4% since first listed2 events — show timeline
- 2026-04-27 Price Changed $76,500 UNYREIS
- 2026-04-27 Listed $71,900 UNYREIS
Cash-flow waterfall
monthlySold comps — $/sqft
last 12 mo · ≤1 miLoading sold comps…