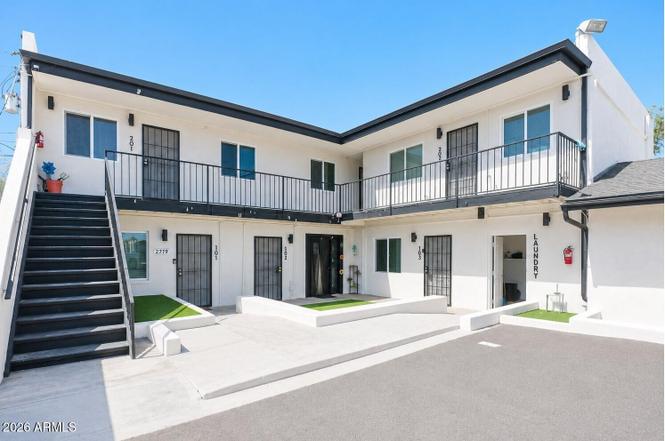
2719 W Maryland Ave
Phoenix, AZ 85017
$1,385,000F
72 bd · 64.0 ba ·
2,106 sqft ·
Built 1971
· MultiFamily
· Active
· 1 DOM
Cashflow @ list (25.0% down · 7.5%)
Estimated rent
$8,549/mo
Mortgage (P&I)
−$7,263
Tax + insurance
−$2,308
HOA
−$0
Vac / Maint / Mgmt
−$1,795
Net cashflow
$-2,818/mo
Annual
$-33,813/yr
Cap rate
3.85%
Cash-on-cash
-8.72%
DSCR
0.61
1% rule
0.62%
Cash to close
$387,800
Investor read
- This is a 6×1bd/1.0ba + 1×2bd/1.0ba + 1×?bd/1.0ba units multifamily listed at $1.39M.
- At list price, monthly cash flow is $-3k ($-34k/yr) — negative. Per door: $-352/mo.
- To cash-flow at today's rent, offer at most $977k (29.4% below list).
- To meet the 1% rule (rent ≥ 1% of price), the offer needs to be $855k (38.3% below list).
- Only 1 days on market — expect competitive offers; lowballing is unlikely to land.
- Recommended offer: $855k (38.3% below list) — sets the bar for 1% rule.
- Local home prices are declining (-3.0%/yr); year-one equity from $10k of loan paydown is wiped out by about $42k of value loss. Plan a longer hold.
- Location reads 75/100 on livability (#16 in AZ, #3,924 nationally) — a middle-class / working-renter tenant base. Strengths: amenities A+, commute A+, housing A+; Watch: health & safety C-, crime F.
- Glendale Union High School District (4285) (urban): math 23% / reading 31% proficiency, ranked #130 of 249 in AZ (top 52%) — low school quality limits family demand, transient renter base, plan for 1-2y turnover.
- Market conditions: Rents soft (-0.3%/yr); 87 active listings in the ZIP; 36,011 units permitted in Maricopa County in 2024 (12,801 in 5+ unit buildings).
- Maricopa County population projected at +38% by 2050 — long-run rental-demand tailwind backs the buy-and-hold thesis.
- 10 sale attempts since 20y ago with the ask held roughly flat each time — persistent listings suggest the price (not the market) is what's stuck; bring a comps-based counter.
- Current owner paid $680k; list at $1.39M implies a 104% gain — meaningful room to come down on a strong offer.
- Climate carrying-cost: extreme-heat days projected 7→18/yr by 2055 (HVAC capex compounding) — expect insurance premiums to compound above CPI over the hold.
- At $8,549/mo this rent would consume 176% of the median local household income ($58k/yr) (locally 1843% of renters already pay >50% of income on rent) — very limited rent-growth headroom before tenants either downsize or default.
Questions for listing agent
- What do current leases actually rent for vs. the listed asking? Can we see a recent rent roll and the last 12 months of T-12 income?
- Can we see the unit-by-unit rent roll, current vacancy, and any below-market leases? What's the average tenancy length?
- What capital expenditures (roof, boiler, parking lot, exteriors) have been made in the last 5 years, and what's planned in the next 2?
- Built in 1971 — when were the roof, HVAC, electrical panel, plumbing, and water heater last replaced?
- Is there a deadline driving the sale (1031 exchange, divorce, estate, relocation)? That informs how much negotiation room exists.
- Crime grade is F in this area — have there been break-ins, vandalism, or insurance claims at this property in the last 3 years? What carrier currently insures it and at what premium?
- The area grade is low — what's the realistic commute time and amenity access for the typical tenant pool here? Any planned neighborhood developments (good or bad) we should know about?
- What's the average days-on-market for RENTAL listings here right now (not sales)? A rising rental-DOM trend means longer vacancies and softer asking-rent achievability than the comps imply.
CashFlowRE · CFR-ZP9CP92CVPVCDM
· Data 2 days ago
cashflowre.app · 2026-05-29