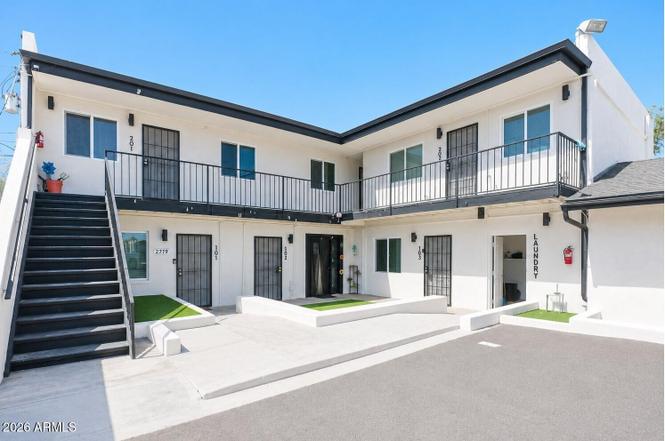
 8-Plex
2719 W Maryland Ave · Phoenix, AZ
Flood risk 1/10 · Minimal
- FEMA flood zone
- X (shaded)
- Chance of flooding over 30 yrs
- 0.0%
- Est. flood insurance / yr
- $507 – $1,088
Fire risk 1/10 · Minimal
- Est. fire insurance / yr
- $610 – $1,132
Heat risk 9/10 · Severe
- Hot days now (above 112°F)
- 7 days/yr
- Hot days in 30 yrs
- 18 days/yr
Wind risk 1/10 · Minimal
- Chance of severe wind over 30 yrs
- —
Air-quality risk 3/10 · Minor
- Unhealthy air days now
- 3 days/yr
- Unhealthy air days in 30 yrs
- 3 days/yr
Risk factors via First Street. Map © Google.
Why this score? — see what drove the F grade
The composite is a weighted blend of 9 inputs, each scored 0–100. Each bar is that input's sub-score; the figure is the points it added to the 100-point composite (weight × sub-score).
- ARV discount +7.5/15.0
- Cash flow +5.7/30.0
- Livability +3.8/5.0
- Condition / age +2.5/5.0
- Rent growth +2.4/5.0
- Schools +2.3/10.0
- 1% rule +1.2/10.0
- DSCR +0.1/10.0
- Appreciation +0.0/10.0
$1,385,000
🖨 Deal sheet 📄 Offer letter ✓ Due diligence
Multi-family units
County records classify this as Multi-Family (5+ Unit). Listing-text estimate: 8 units. confirmed
5+ unit building — per-unit beds/baths from public records are typically unavailable; the breakdown below (if shown) is an estimate from the listing text.
Listing remarks MLS
2719 W Maryland Ave is a value add opportunity consisting of 8 units across two buildings on C-2 zoning. 7 of the 8 units are boarded up and not accessible, and one unit is occupied (front single family residence). This property is bank owned, and appears 12.8% occupied. Please contact broker for additional details.
Key facts
- Repaved asphalt
- New roof
- 9,120 sq ft lot
Tags
Property features AI
Exterior
- Parking: Twelve total parking spaces; Paved parking; Approximately 1 space per unit
- Utilities: SRP electric service; Public sewer; City franchise water
- Home design: Fee simple ownership; Two buildings on the property
- Construction: Wood frame and block construction; Painted exterior; Built-up roof
- Exterior features: Asphalt road access; No community pool
Interior
- Kitchen: Built-in range; Microwave; Refrigerator; Disposal
- Flooring: Vinyl flooring
- Heating & cooling: Electric heating; Individual electric cooling
- Interior features: Built-in range; Disposal; Microwave; Refrigerator; Other appliances as noted; Vinyl flooring
Neighborhood map
What this means for you Summary
Snapshot
- This is a 6×1bd/1.0ba + 1×2bd/1.0ba + 1×?bd/1.0ba units multifamily listed at $1.39M.
Deal economics
- At list price, monthly cash flow is $-3k ($-34k/yr) — negative. Per door: $-352/mo.
- To cash-flow at today's rent, offer at most $977k (29.4% below list).
- To meet the 1% rule (rent ≥ 1% of price), the offer needs to be $855k (38.3% below list).
- Recommended offer: $855k (38.3% below list) — sets the bar for 1% rule.
Location & tenants
- Location reads 75/100 on livability (#16 in AZ, #3,924 nationally) — a middle-class / working-renter tenant base. Strengths: amenities A+, commute A+, housing A+; Watch: health & safety C-, crime F.
- Glendale Union High School District (4285) (urban): math 23% / reading 31% proficiency, ranked #130 of 249 in AZ (top 52%) — low school quality limits family demand, transient renter base, plan for 1-2y turnover.
- Market conditions: Rents soft (-0.3%/yr); 87 active listings in the ZIP; 36,011 units permitted in Maricopa County in 2024 (12,801 in 5+ unit buildings).
- At $8,549/mo this rent would consume 176% of the median local household income ($58k/yr) (locally 1843% of renters already pay >50% of income on rent) — very limited rent-growth headroom before tenants either downsize or default.
Forward outlook
- Local home prices are declining (-3.0%/yr); year-one equity from $10k of loan paydown is wiped out by about $42k of value loss. Plan a longer hold.
- Maricopa County population projected at +38% by 2050 — long-run rental-demand tailwind backs the buy-and-hold thesis.
Negotiation context
- Only 1 days on market — expect competitive offers; lowballing is unlikely to land.
- 10 sale attempts since 20y ago with the ask held roughly flat each time — persistent listings suggest the price (not the market) is what's stuck; bring a comps-based counter.
- Current owner paid $680k; list at $1.39M implies a 104% gain — meaningful room to come down on a strong offer.
Risks & watch-outs
- Climate carrying-cost: extreme-heat days projected 7→18/yr by 2055 (HVAC capex compounding) — expect insurance premiums to compound above CPI over the hold.
Questions for the listing agent
- What do current leases actually rent for vs. the listed asking? Can we see a recent rent roll and the last 12 months of T-12 income?
- Can we see the unit-by-unit rent roll, current vacancy, and any below-market leases? What's the average tenancy length?
- What capital expenditures (roof, boiler, parking lot, exteriors) have been made in the last 5 years, and what's planned in the next 2?
- Built in 1971 — when were the roof, HVAC, electrical panel, plumbing, and water heater last replaced?
- Is there a deadline driving the sale (1031 exchange, divorce, estate, relocation)? That informs how much negotiation room exists.
- Crime grade is F in this area — have there been break-ins, vandalism, or insurance claims at this property in the last 3 years? What carrier currently insures it and at what premium?
- The area grade is low — what's the realistic commute time and amenity access for the typical tenant pool here? Any planned neighborhood developments (good or bad) we should know about?
- What's the average days-on-market for RENTAL listings here right now (not sales)? A rising rental-DOM trend means longer vacancies and softer asking-rent achievability than the comps imply.
- What's the recent tenant-quality profile in this submarket — average credit score on applications, eviction rate, late-payment / NSF rate, and stable-employment percentage? A property-management company in the area should have these aggregated.
- How much new apartment / multifamily construction is in the pipeline within 1–3 miles? Heavy new supply (>2% of stock underway) typically softens rents 12–24 months out; light construction supports rent growth.
Investment metrics
- 1% rule
- 0.62% ✗
- Cap rate
- 3.85%
- Cash-on-cash
- -8.72%
- DSCR
- 0.61
- GRM
- 13.5
CMA / ARV
No comps found within radius.
Projected returns pro-forma
-3.0% appreciation · 0.0% rent growth · sell at horizon
- IRR
- -35.1%
- Equity multiple
- -0.11×
- Total profit
- $-428,816
- Equity at exit
- $206,508
- IRR
- -69.0%
- Equity multiple
- -0.81×
- Total profit
- $-700,790
- Equity at exit
- $119,749
Cash invested: $387,800 (down + closing). Projections, not guarantees.
Landlord ↔ Tenant lean methodology
- Overall (STATE)
- 87 Strongly Landlord-Friendly
- State Arizona
- 87 Strongly Landlord-Friendly · R+3
- County
- — inherits STATE
- City
- — inherits STATE
ZIP-level market 85017
- Home prices YoY
- -14.4%
- Rents YoY
- -0.3%
- Active inventory
- 87
- Price-to-rent
- 110.6×
Monthly cashflow live
- Estimated rent
- $8,549 high interval (Pro) →
- Mortgage (P&I)
- −$7,263
- Tax est. 1.5%
- −$1,731 /mo · $20,775/yr
- Insurance
- −$577
- HOA
- −$0
- Vacancy / Maint / Mgmt
- −$1,795
- Net cashflow
- $-2,818
Break-even live
8-unit breakdown (identical units grouped — click to expand)
| Units | Beds | Baths | Est. rent |
|---|---|---|---|
| 6× units | 1 | 1 | $6,258 |
| #1 | 1 | 1 | $1,043 |
| #2 | 1 | 1 | $1,043 |
| #3 | 1 | 1 | $1,043 |
| #4 | 1 | 1 | $1,043 |
| #5 | 1 | 1 | $1,043 |
| #6 | 1 | 1 | $1,043 |
| 1× unit | 2 | 1 | $1,208 |
| 1× unit | 0 | 1 | $1,082 |
| Total (8 units) | $8,549 | ||
UW: 25.0% down · 7.5% · 30yr · 1.5% tax · 5.0% vac · 8.0% maint · 8.0% mgmt
Financing live
Cash to close
- Down payment
- $346,250
- Closing costs
- $41,550
- Reserves months
- —
- Total cash needed
- —
Loan-product check · same deal, 3 products live
Conventional
25% down · 7.5% · 30yr
- Down + closing
- —
- Monthly P&I
- —
- Monthly cashflow
- —
- DSCR
- —
- Eligible?
- —
Personal DTI + credit; lowest rate.
DSCR
20% down · 8.5% · 30yr
- Down + closing
- —
- Monthly P&I
- —
- Monthly cashflow
- —
- DSCR
- —
- Eligible?
- —
No personal income docs; deal must DSCR.
Hard money
10% down · 12.0% · 12mo
- Down + closing
- —
- Monthly P&I
- —
- Monthly cashflow
- —
- DSCR
- —
- Eligible?
- —
Short-term bridge; refi at stabilization.
Listing history 2 events
-
2026-06-17remarks 699-char remark
-
2026-06-17$1,385,000 Active 1 DOM
ⓘ Source: listings_history table (triggers on properties + properties_extension) + one-shot
backfill from property_details.listing_events for pre-trigger history.
Climate risk First Street
- Flood 1/10 Low FEMA zone X (shaded) · 0% chance over 30 yrs
- Wildfire 1/10 Low
- Heat 9/10 Extreme 7 d/yr ≥112°F today · 18 d/yr by 30 yrs out
- Wind 1/10 Low
- Air quality 3/10 Moderate 3 unhealthy d/yr today · 3 by 30 yrs out
Nearby sold comps map
Loading sold comps map…
Walkable amenities ~0.75 mi
Loading nearby amenities…
Taxation est. · year 1
- Rental income
- $102,588
- − Mortgage interest
- −$77,582
- − Property taxes
- −$20,775
- − Insurance
- −$6,925
- − Repairs & maintenance
- −$8,207
- − Management
- −$8,207
- − Depreciation
- −$40,291
- Taxable loss
- −$59,399
- Est. tax savings @ 24.0%
- +$14,256
- After-tax cash flow
- $-19,557/yr
For passive investors: Depreciation is non-cash, so a rental often shows a tax loss while cash-flowing — sheltering income. Rental losses are passive: they offset passive income freely, and up to $25,000/yr can offset ordinary (W-2) income if you actively participate and your MAGI is under $100k (phasing out to $0 by $150k); unused losses carry forward. On sale, claimed depreciation is recaptured at up to 25%, and gains may owe capital-gains tax (a 1031 exchange can defer both). Figures are a year-1 estimate at your 24.0% rate — not tax advice; consult a CPA.
Schools (NCES district)
- District
- Glendale Union High School District (4285)
- NCES district ID
- 0403450
- Math proficiency
- 23% ▼ -38.00%
- Reading proficiency
- 31% ▼ -19.00%
- Median HH income
- $40,846
- Composite
- 22.81/100
- National rank
- #8020
- State rank
- #130 of 249 in AZ
Livability — Phoenix
- Score
- 75/100
- State rank
- #16
- US rank
- #3924
Category grades
Schools grade is shown separately in the Schools card above.
Census & demographics
- Census place
- Phoenix, AZ
- County
- Maricopa County · 4,537,380 people
- City population
- 1,500,198
- Metro
- Phoenix-Mesa-Chandler, AZ
- Population (ZIP)
- 46,129
- Household income
- $58,346
- Rent vs Own
- Severe rent burden
- 1843.0
Population outlook (Maricopa County) Hauer SSP2
- Today (2025)
- 4,979,203 people
- By 2030
- 5,378,229 · +8.0%
- By 2040
- 6,156,598 · +23.6%
- By 2050
- 6,872,376 · +38.0%
- By 2075
- 8,401,270 · +68.7%
- By 2100
- 9,247,439 · +85.7%
Race, ethnicity, and origin ACS 2023
- Neighborhood character
- Diverse neighborhood (Simpson 0.58)
- Race & ethnicity
- Hispanic / Latino 61% Two or more races 31% White 20% Black 10% Asian 3% Native American 2%
- Hispanic origin (detail)
- Mexican 54%
- Common ancestry
- Iranian 1% Italian 1% Portuguese 1%
- Foreign-born
- 31% · Canada, Philippines, Vietnam
- Languages at home
- 40% English-only · Spanish 51% Other Asian/Pacific 2% Other Indo-European 1%
Political lean MEDSL · Maricopa
- 2024 margin
- Toss-up / Even · D 47.7% · R 51.2% · Other 1.1%
- 2008→2024 swing
- +7.1pp toward D · 2008: -10.6pp · 2024: -3.5pp
- All cycles
- 2024: R+3.5 2020: D+2.2 2016: R+3.5 2012: R+12.0 2008: R+10.6
Not yet ingested
- Civics
- —
Market trends
- HPI YoY
- ▼ -79.21%
- Current HPI
- 471.0211
- Rent YoY
- ▼ -0.33%
- Metro
- Phoenix-Mesa-Chandler, AZ
- State GDP YoY
- ▲ 4.54%
- F500 in state
- 20
Industry mix (Fortune 500 HQ in AZ)
| Industry | F500 HQs | Revenue |
|---|---|---|
| Technology | 2 | $13B |
|
||
| Mining / Metals | 1 | $23B |
|
||
| Environmental Services | 1 | $16B |
|
||
| Metals / Steel | 1 | $14B |
|
||
| Technology Distribution | 1 | $9B |
|
||
| Homebuilding | 1 | $8B |
|
||
Price history
+729.3% since first listed32 events — show timeline
- 2026-06-17 Listed $1,385,000 ARMLS
- 2024-12-03 Sold (MLS) $680,000 ARMLS
- 2024-12-02 Pending — ARMLS
- 2024-10-31 Listed $800,000 ARMLS
- 2022-01-14 Price Changed $1,156 RENT.
- 2020-01-27 Sold (Public Records) $530,000 Public Records
- 2012-11-09 Sold (Public Records) $185,000 Public Records
- 2012-10-31 Sold (MLS) $185,000 ARMLS
- 2012-10-28 Pending — ARMLS
- 2012-06-05 Relisted — ARMLS
- 2012-06-01 Listing Removed — ARMLS
- 2012-05-21 Relisted — ARMLS
- 2012-05-17 Pending — ARMLS
- 2012-02-22 Listed $230,000 ARMLS
- 2011-03-11 Sold (MLS) $93,500 ARMLS
- 2011-03-09 Sold (Public Records) $93,500 Public Records
- 2011-02-04 Pending — ARMLS
- 2010-11-12 Listed $110,000 ARMLS
- 2010-07-02 Listing Removed — ARMLS
- 2010-01-07 Listed $184,000 ARMLS
- 2008-09-11 Listing Removed — ARMLS
- 2008-05-08 Listed $399,000 ARMLS
- 2008-04-23 Listing Removed — ARMLS
- 2008-02-27 Listed $420,000 ARMLS
- 2006-05-09 Sold (Public Records) $350,000 Public Records
- 2006-04-30 Listing Removed — ARMLS
- 2006-02-01 Listed $365,000 ARMLS
- 2004-05-03 Sold (Public Records) $250,000 Public Records
- 1998-02-11 Sold (Public Records) $150,000 Public Records
- 1995-02-15 Sold (Public Records) $100,000 Public Records
- 1986-06-09 Sold (Public Records) $198,000 Public Records
- 1985-02-04 Sold (Public Records) $167,000 Public Records
Property tax history
-3.0%/yrLatest (2025): $2,493 · +2.1% YoY. Source: county tax records.
Cash-flow waterfall
monthlySold comps — $/sqft
last 12 mo · ≤1 miLoading sold comps…